
By: Ted Dabrowski and John Klingner
There’s nothing in the U.S. Census migration data to tell us what exactly Illinois’ neighbors have done to improve their migration demographics. But whatever it is, their numbers have become better over time, especially compared to Illinois.
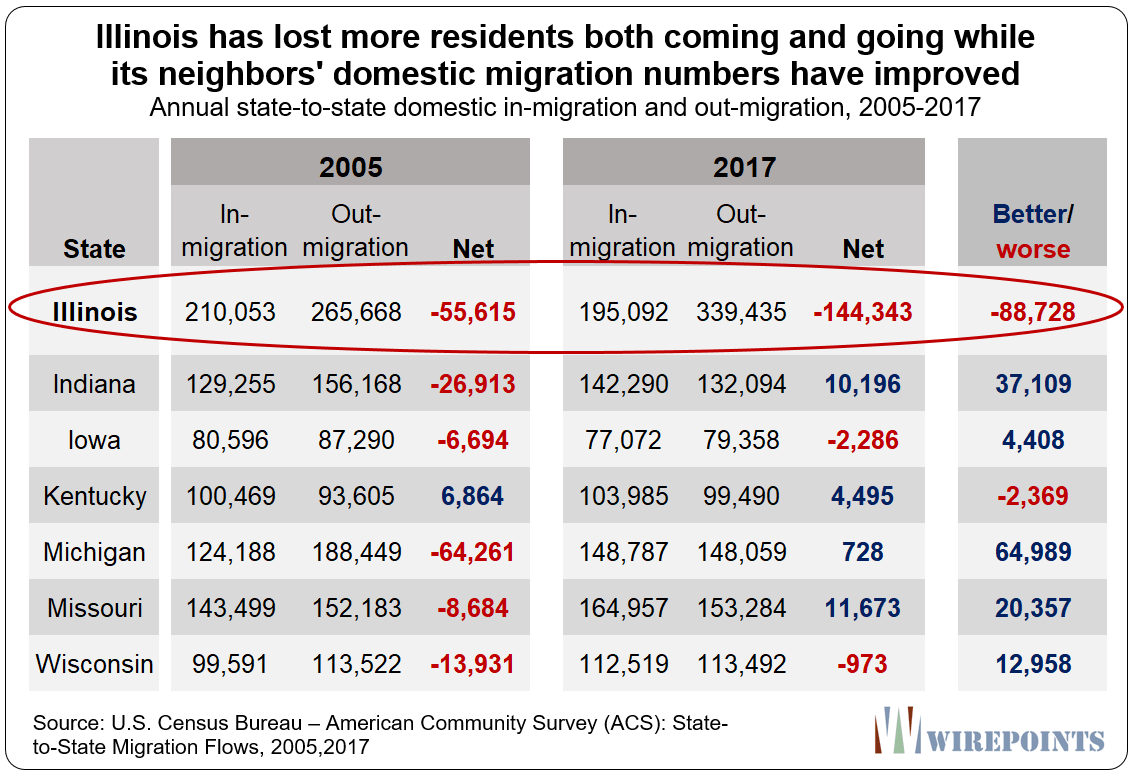
In 2005, Indiana lost a net 27,000 people to domestic out-migration, according to the U.S. Census Bureau’s American Community Survey.* Today, that state has more people coming in and fewer people leaving. The net result is a positive 10,000 in net in-migration.
The same goes for Michigan and Missouri. They now gain people from domestic migration instead of losing them.
Those states’ experiences begs the question. Are reforms to collective bargaining laws, lower taxes, and improved business climates the secret to keeping residents and attracting new ones? That’s been the experience of Illinois’ neighbors. Meanwhile, out-migration from Illinois has only accelerated.
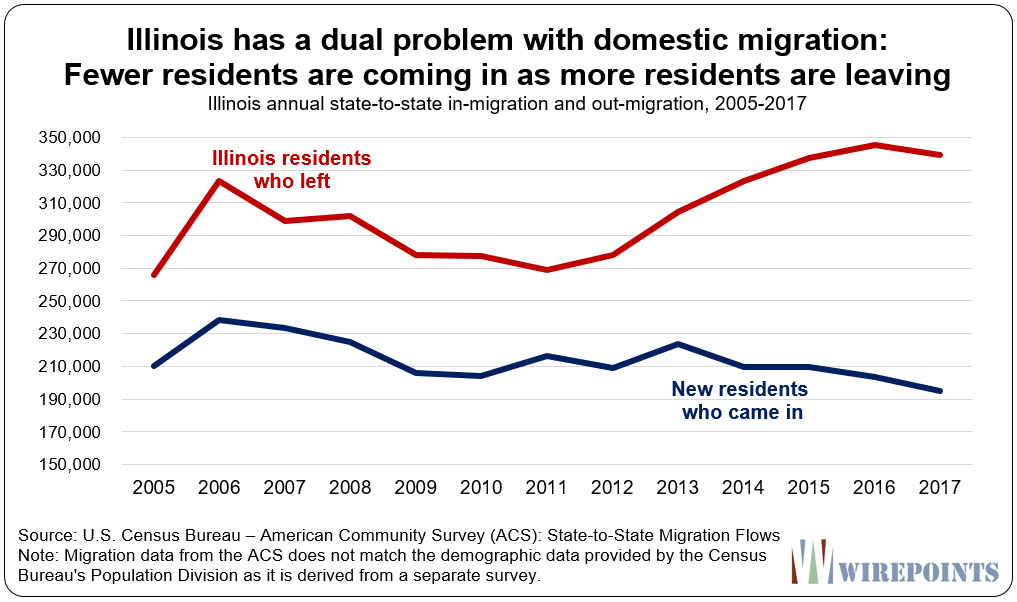
The U.S. Census Bureau’s American Community Survey has published state-to-state domestic migration data for the years 2005 through 2017. The domestic migration data is made up of two parts: current residents leaving and new residents moving in.
The big problem for Illinois is that both parts have gotten worse over the survey period. The percentage of residents leaving Illinois jumped 28 percent between 2005 and 2017, to 340,000 from 266,000. At the same time, the number of people moving into the state shrank a total of 7 percent, to 195,000 from 210,000.
In all, Illinois lost nearly 90,000 more net residents in 2017 than it did in 2005.
Meanwhile, Michigan has seen big positive changes. It lost over 64,000 net people a year to out-migration in 2005. Since then, the annual number of residents leaving the Wolverine state has fallen and more people have started moving in. In 2017, Michigan basically broke even on domestic migration.
Indiana’s story is similar. It used to lose far more people to out-migration than it gained from in-migration, causing the state a net loss of 27,000 residents in 2005. In 2017, Indiana ended up gaining more than 10,000 people, a net change of 37,000.
Kentucky was the only neighbor to experience a negative change over the period. Instead of gaining nearly 7,000 people a year to migration, it now only gains 4,500. Its domestic migration numbers have basically stagnated, though they are still positive.
Wisconsin and Iowa are the only neighbors that lost a net number of residents to out-migration in both 2005 and 2017. However, the situation in both states has improved. For example, in 2005, Wisconsin lost nearly 14,000 people to out-migration. In 2017, it lost less than 1,000.
That’s a far cry from the out-migration problems in Illinois. Losing a few hundred people every year is nothing compared to losing 144,000 a year.
That net loss is a clear indicator of how uncompetitive Illinois has become. Other states in the Rust Belt are experiencing the same difficult economic changes, but Illinois is the only one among its neighbors to suffer from a massive out-migration problem.
Read more about Illinois’ out-migration problem and its larger demographic decline:
- Illinois’ demographic collapse: fewer immigrants, fewer babies and fleeing residents – Wirepoints Special Report
- New U.S. Census data: Shrinking Illinois loses population 5 years in a row
- Illinois a national outlier when it comes to losing residents
*Wirepoints reports on two seperate domestic out-migration numbers based on two different Census Bureau datasets. The American Community Survey [ACS] State-to-State Migration is a different dataset from the one used in Wirepoint’s recent report: Illinois’ demographic collapse. The report largely uses annual demographic data provided by the Census Bureau’s Population Division.
The ACS dataset is derived from individual citizen surveys while the Population Division’s demographic dataset is derived from state and federal administrative data. Due to their different sources, the surveys’ annual domestic migration numbers can differ significantly from each other and should not be directly compared. For example, The ACS data says Illinois’ net out-migration equaled 144,000 residents in 2017 while the demographic data says 114,000 net residents left.
The two surveys should be used to confirm the broad trend of net in- or out-migration in a state over time. Wirepoints relies primarily on the demographic data because it also measures states’ total annual population change while the ACS state-to-state survey data does not.

 Hopefully, all media will get the message, in Illinois, too.
 Ted joined Tom Miller of WJPF to talk about Illinois’ highest-in-the-nation property taxes, why lawmakers don’t want to touch the tax’s cost drivers, just how much Illinoisans’ tax burden has grown over the decades, why Gov. Pritzker failed to meet his promise to reform property taxes, and more.
Can’t wait to leave Illinois. Only one more week to go. My appreciation to those of you who will pick up my portion of the state’s debt ($100,000.00 more or less). Suckers ! Just kidding….sort of.