
By: Ted Dabrowski and John Klingner
Download a PDF copy of the report
Addendum: Financial and student achievement data for individual districts
A Wirepoints analysis of new U.S. Census education finance data for 2019 dispels the constant claims by lawmakers and education officials that Illinois needs billions in additional Pre-K to 12 funding. At $16,227 per student, Illinois spent more in 2019 than every state in the entire Midwest, a position Illinois has held since 2010.
More importantly, Wirepoints found Illinois’ per student spending grew 70 percent between 2007 and 2019, the most in the nation. That’s nearly two times more than the national average over the same period.
 All that additional funding hasn’t translated into better outcomes for Illinois students. Wirepoints analyzed National Assessment of Educational Progress (NAEP) data and found that Illinois test scores have basically flatlined since 2007.
These findings matter because there’s been a constant push in Illinois to keep increasing education funding. Lawsuits for more state funding have been a common occurrence for decades.
More recently, former Gov. Bruce Rauner declared the state’s education spending inadequate in 2017 and worked with the educational establishment to pass a new “evidence-based” funding model that demands a total of $7 billion in additional state spending over a decade. Gov. J.B. Pritzker has embraced that same “underfunded” narrative and continues to push for additional funding every year.
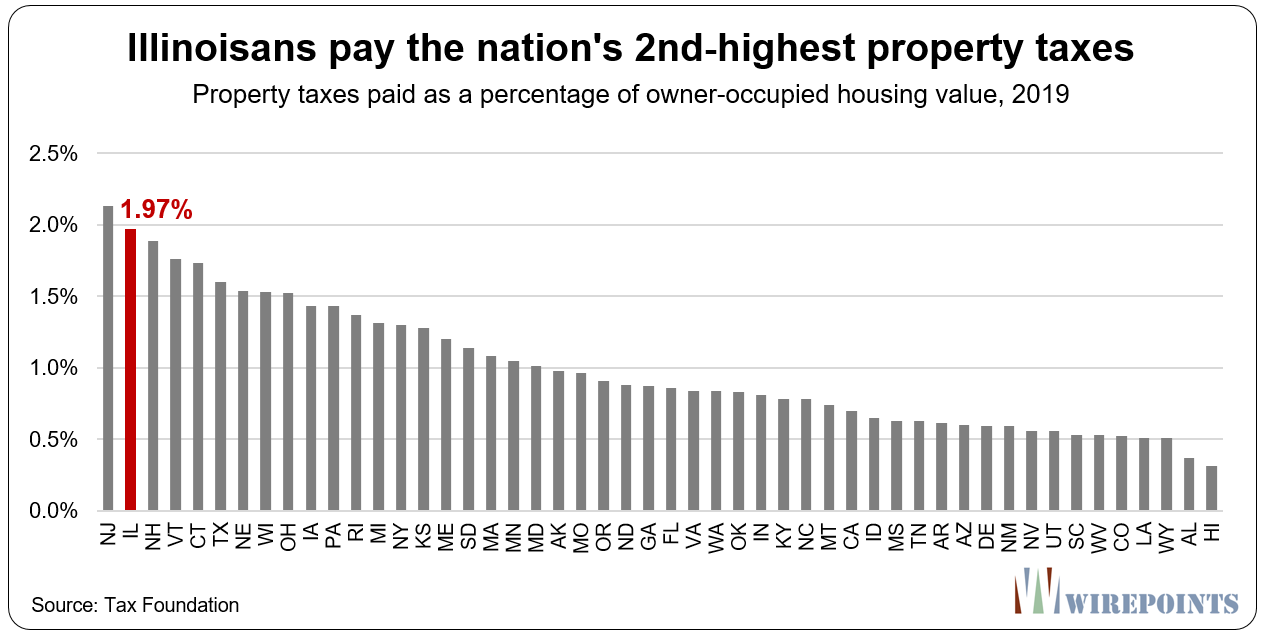
But what’s lost in the spending demands of politicians and education officials is that Illinoisans already pay one of the highest overall tax burdens – and the nation’s 2nd-highest property taxes – for a system that includes:
- Hundreds of overlapping, duplicative school districts, many that serve just one school or fewer than 600 students.
- A bloated, growing administrative bureaucracy, where non-teaching and administrative staffing has skyrocketed compared to the growth in teachers and students.
- Retirement perks, like unused sick leave, salary spiking, double-dipping, pension pick-ups and compounded 3 percent COLAs that drive up pension costs.
- A regressive pension funding system that overwhelmingly benefits wealthier school districts at the expense of needier ones.
- Multimillion-dollar lifetime pensions for thousands of district administrators.
All that and more has served to siphon away billions in direct funding for classrooms and Illinois’ neediest districts. It’s also pushed property taxes to levels that are far higher than in the rest of the country.
Key findings
Illinois lawmakers should focus on how to better spend the education money Illinois already has. But to get there, the narrative that Illinois doesn’t spend enough must be rebutted. That is the subject of this report. The key findings of Wirepoints’ analysis include:
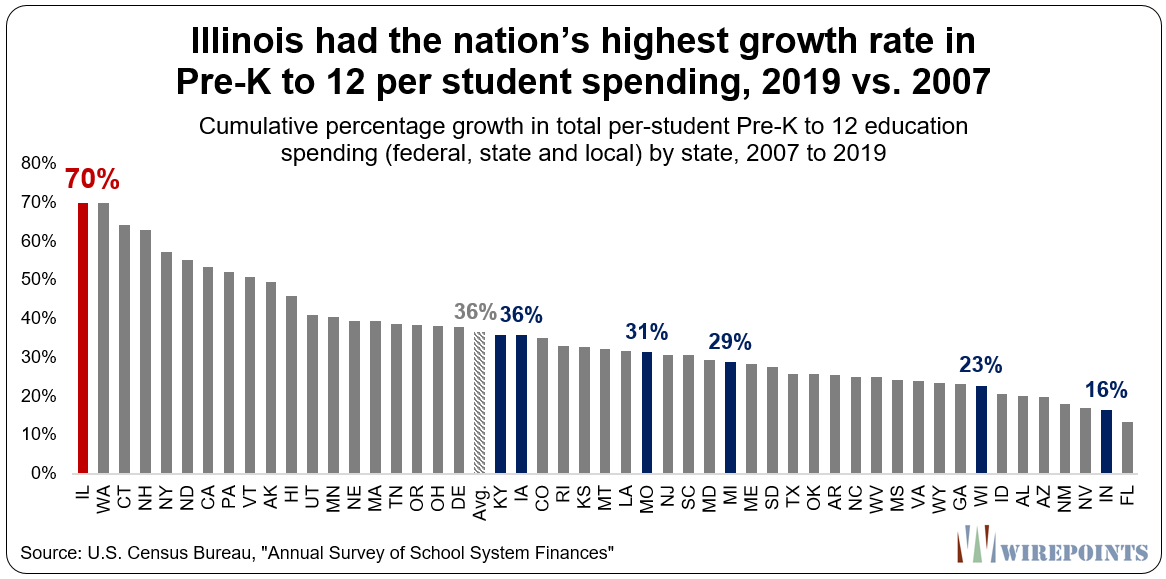
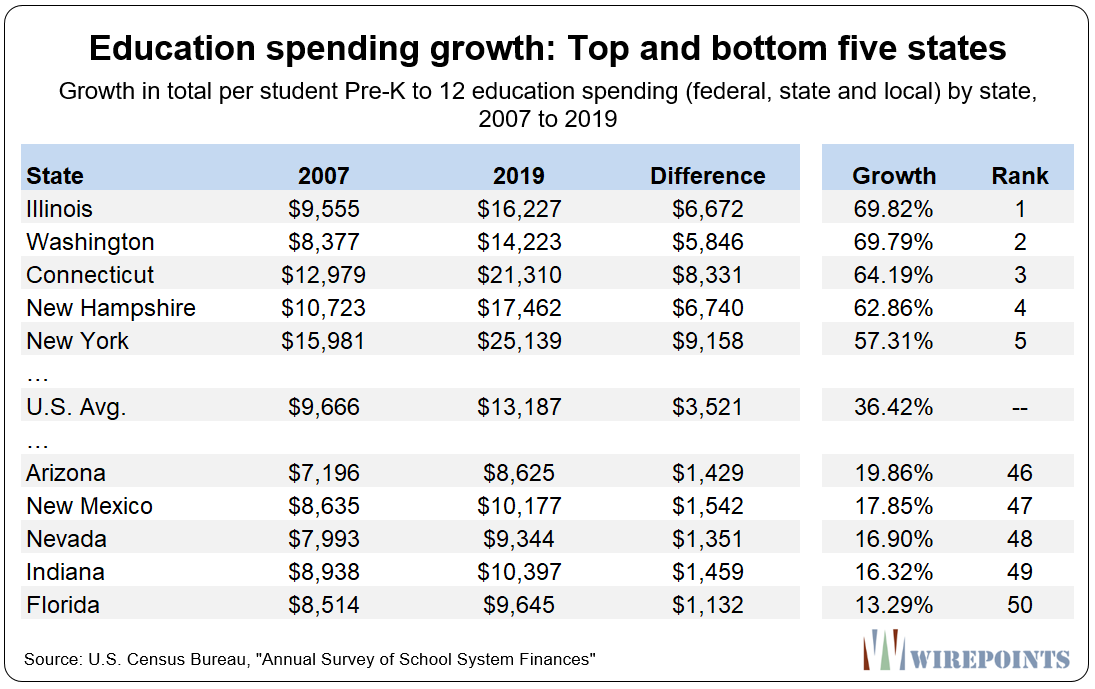
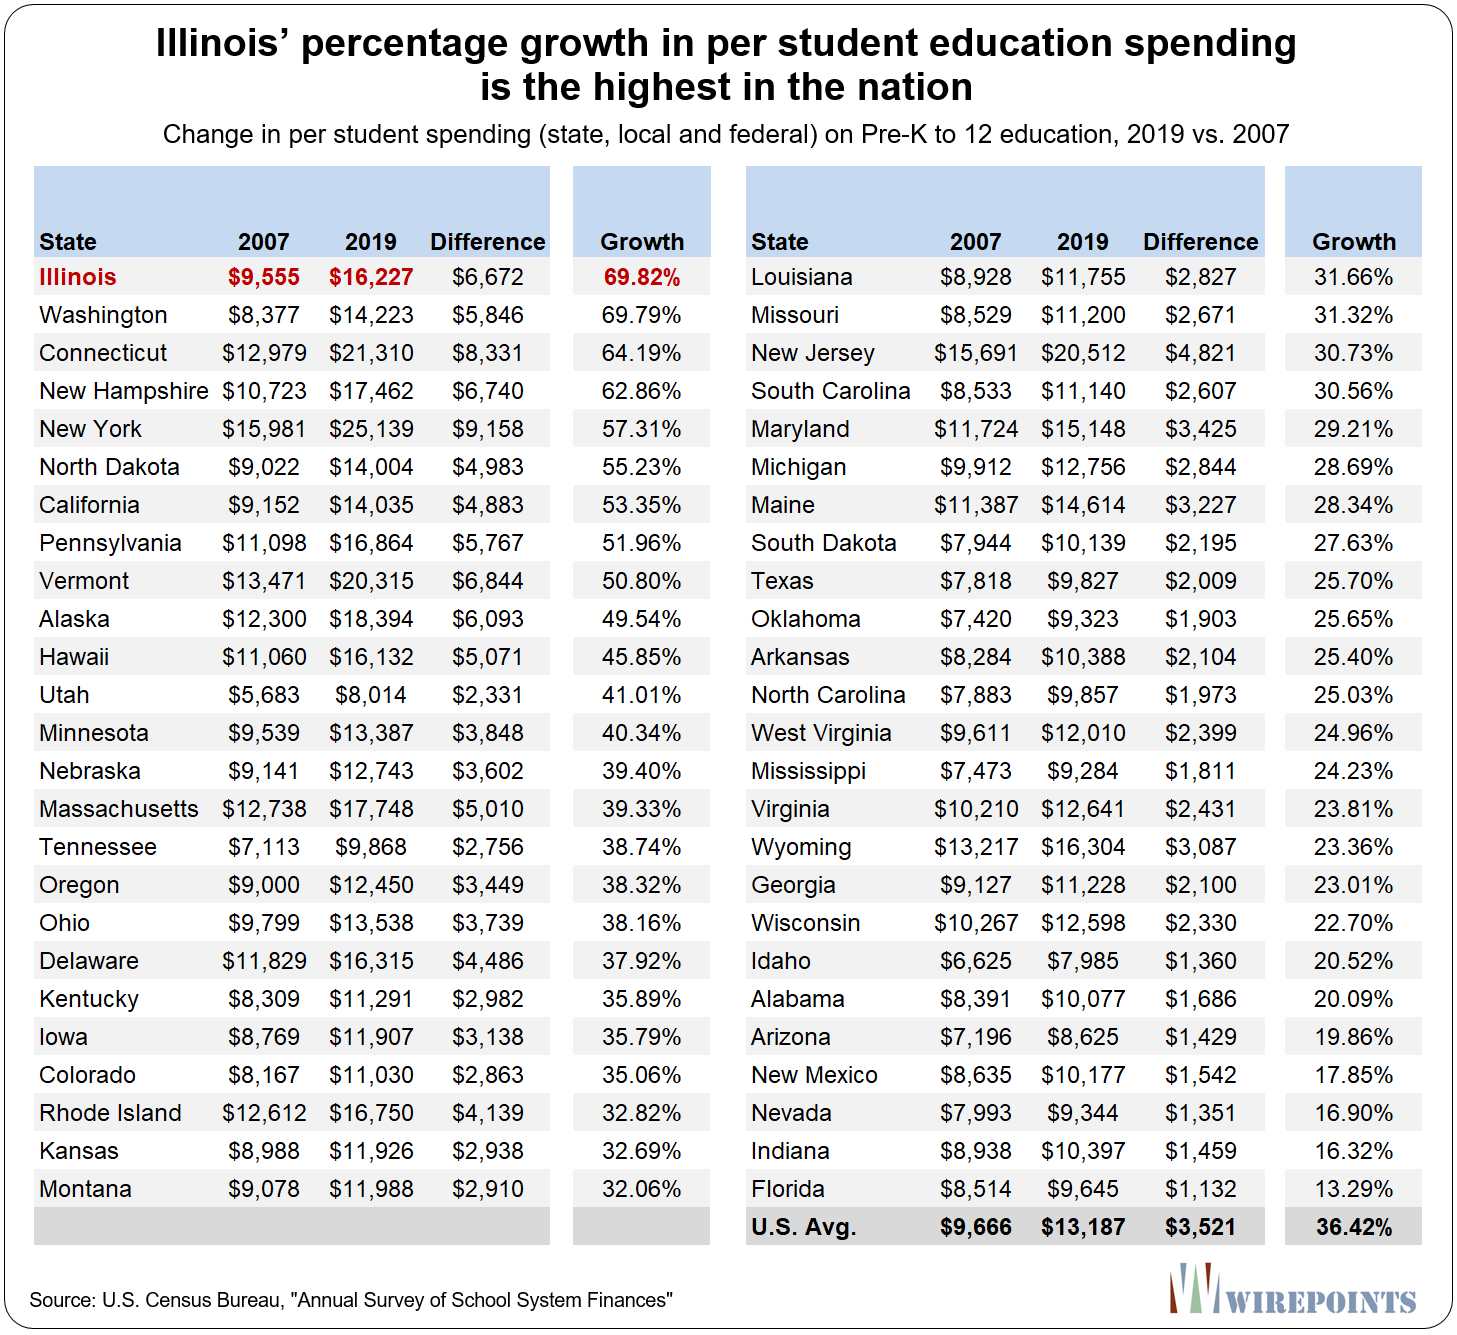
1. Illinois education spending per student grew more on a percentage basis than any other state in the country. At 70 percent, Illinois’ spending growth (local, state and federal) over the 2007-2019 period was almost double the national average (36 percent) and five times greater than Florida (13 percent), the state with the smallest education funding growth in the country. Wirepoints chose 2007 as the starting year to avoid the volatility in education funding during the Great Recession.
If Illinois’ education spending since 2007 had grown at the same pace as the national average, Illinois would be spending $6 billion fewer dollars on education today. For context, Illinois spent a total of $37 billion in 2019 (includes federal, state and local funding).
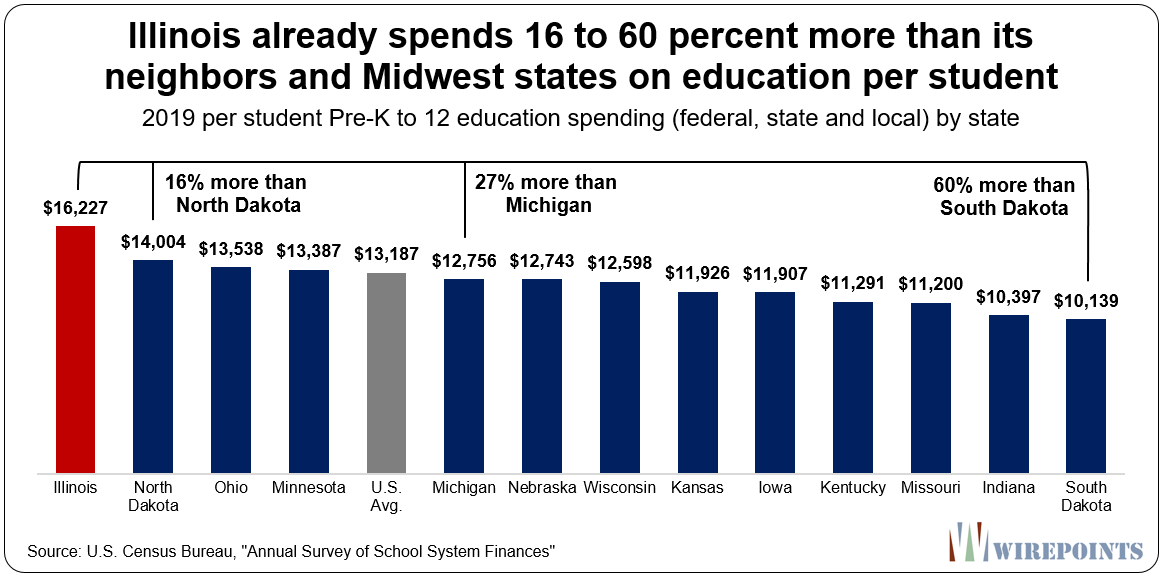
2. Illinois spent far more per student than any other state in the Midwest in 2019. At $16,227, Illinois spent 16 percent more than North Dakota ($14,004), 27 percent more than Michigan ($12,756), 60 percent more than South Dakota ($10,139) and 23 percent more than the national average ($13,187). Across all 50 states, Illinois ranked 12th-highest in total per student spending. Adjusted for cost-of-living, Illinois ranked 8th-highest.
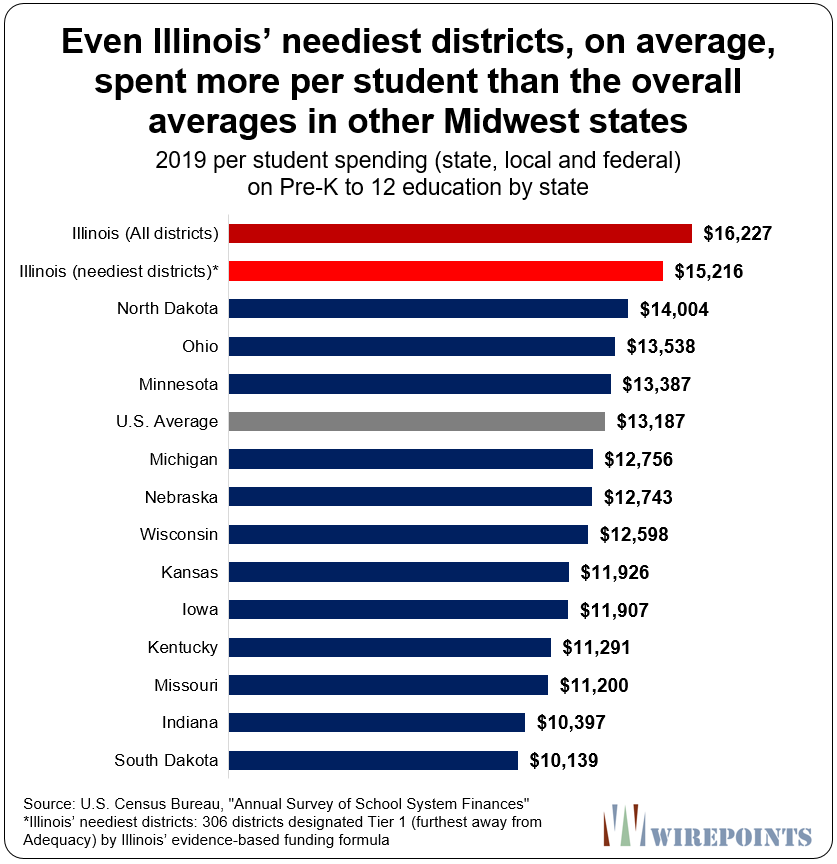
3. Even Illinois’ neediest districts, on average, spent more per student than the overall average in other Midwest states. Illinois’ neediest districts (those designated Tier 1 under Illinois’ evidence-based funding model) spent $15,216 per student in 2019, more than the average per student spend in every other Midwest and neighboring state.
4. Illinois’ education spending growth is still one of the nation’s highest even when controlling for rising pension costs. Even after removing pension contributions from Illinois’ expenditures – while leaving pension spending intact in all other states – Illinois’ per student spending still grew the 10th-most in the nation (49 percent) between 2007 and 2019.
5. Illinois’ increased spending has done little to nothing to improve students’ NAEP scores. Illinois’ National Assessment of Educational Progress (NAEP) math and reading scores for both fourth and eighth-graders have remained virtually flat over the 2007-2019 period. For example, the average math score for fourth-graders was 237 in 2007. In 2019, it was the same. In reading, scores declined to 218 in 2019, down from 219 in 2007.
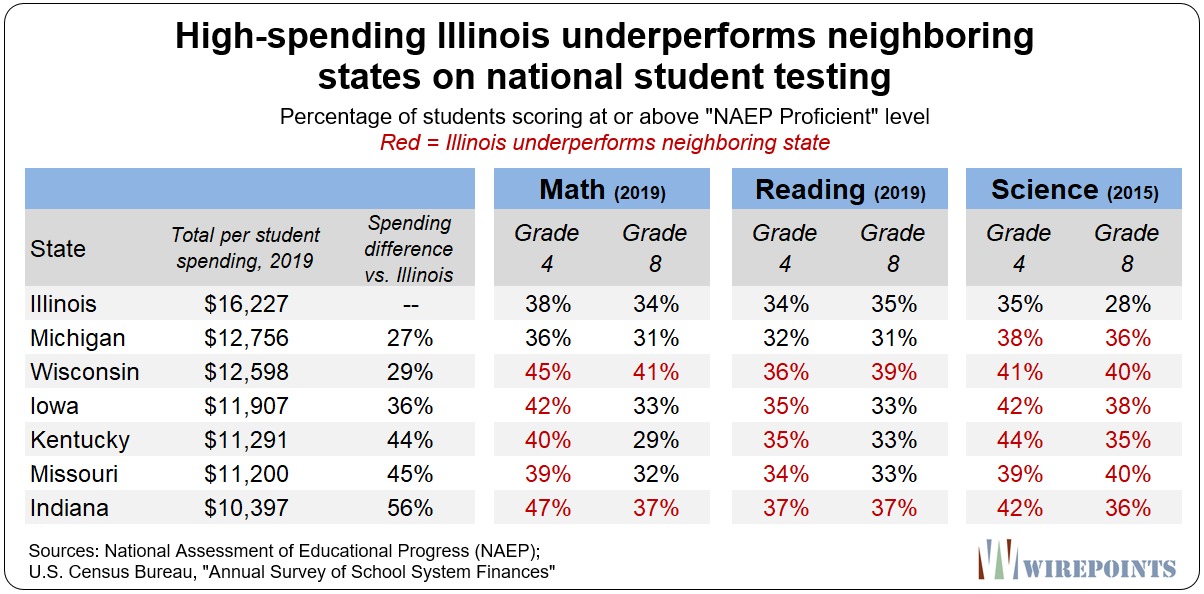
6. Neighboring states achieve better student outcomes while spending far less than Illinois does. Illinois’ neighbors spent 30 to 60 percent less on education per student in 2019. Yet students in those states largely outscore Illinois students on the NAEP. For example, all Illinois neighbors except Michigan had a higher percentage of fourth-grade students score “proficient” in Math, and all neighbors had more fourth- and eighth-grade students score “proficient” in Science.
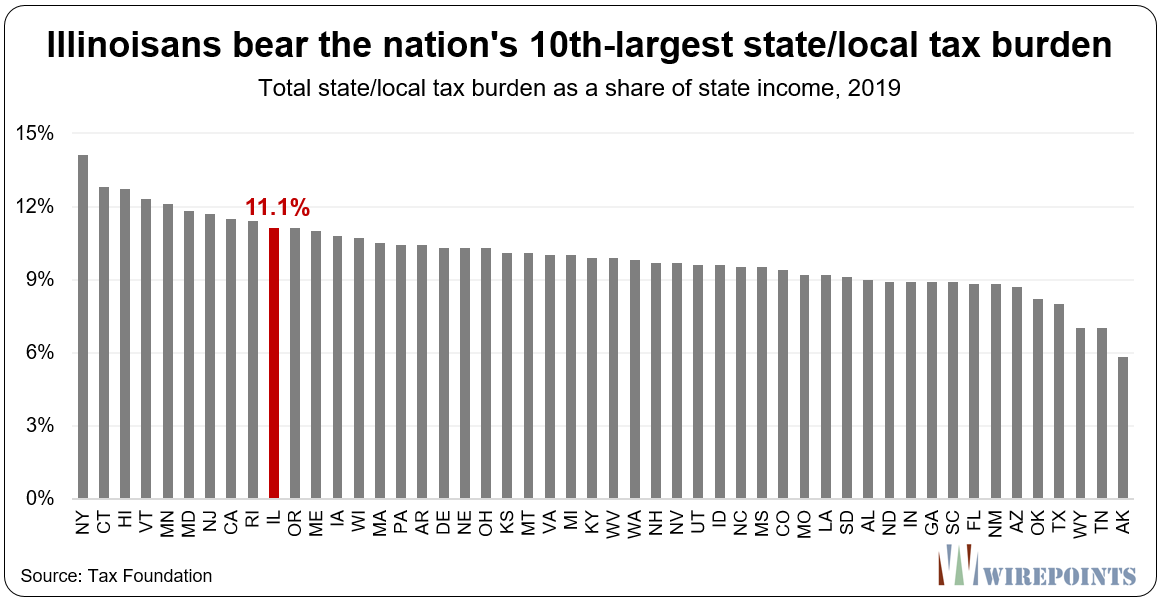
7. Illinoisans already pay the nation’s 10th-highest state and local tax burden, and yet lawmakers want even more taxes to fund education. Illinoisans’ taxes include the nation’s 2nd-highest property taxes, nearly two-thirds of which pay for school district costs. Despite that combined state and local burden, lawmakers and education officials keep demanding the state spend billions more on Pre-K to 12 education.
Percentage growth in per student spending
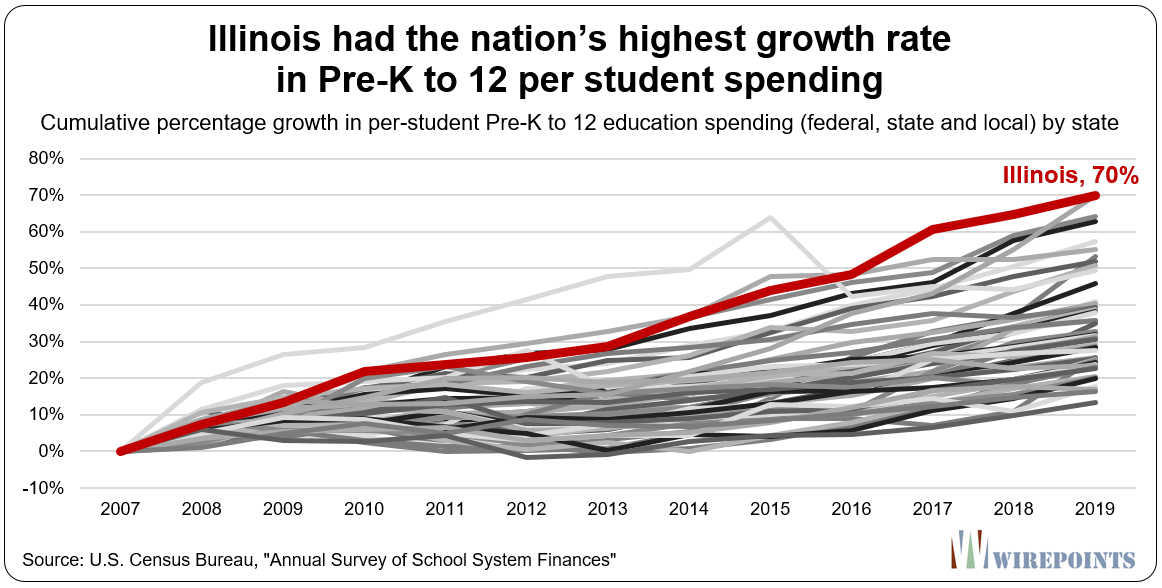
As mentioned above, recently-released U.S. Census data shows Illinois per student education spending grew 70 percent between 2007 and 2019, more than any other state in the nation. Wirepoints chose 2007 as the base year to avoid the volatile funding period that occurred during the Great Recession.
In total, Illinois spent $16,227 per student in 2019, up from $9,555 in 2007. By comparison, the national average was $13,187 per student in 2019, up from $9,666 in 2007. Overall, national Pre-K to 12 spending grew 36 percent over the period.
 Washington, the state with the second-highest growth in the nation over the period, had an increase nearly identical to Illinois. The three other states in the top five, Connecticut, New Hampshire and New York, are all high-spending Northeastern states that grew their spending by more than 50 percent.
The bottom five states, Arizona, New Mexico, Nevada, Indiana and Florida, all grew their per student funding by less than 20 percent over the period. See Appendix A for a full 50-state comparison of per student spending and growth rates.
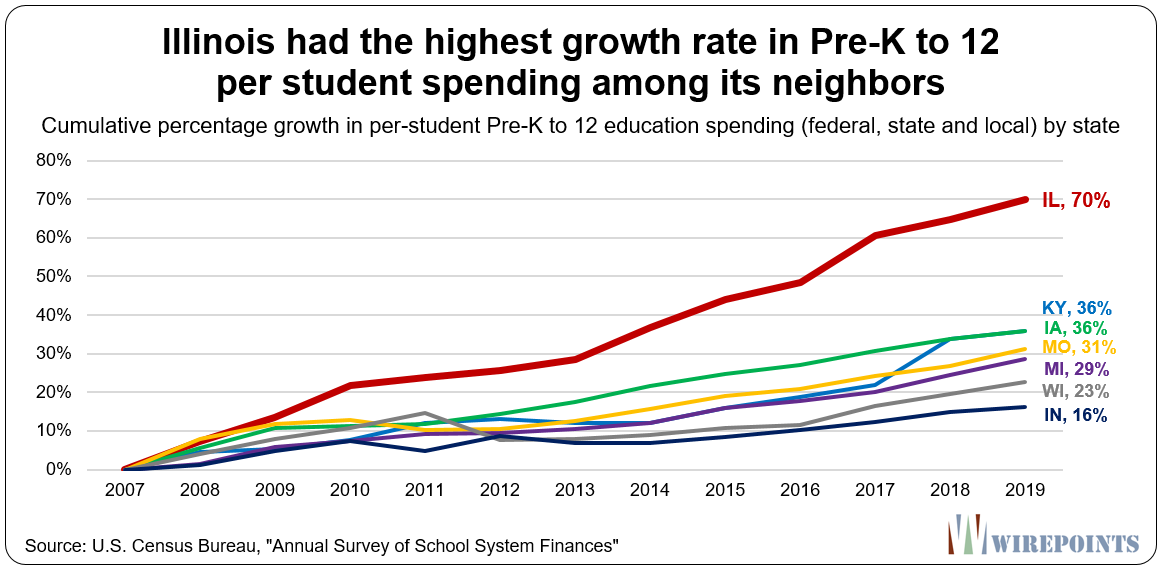
 Illinois achieved its highest-in-nation growth by increasing total spending per student by an average of 4.5 percent a year – over 2.5 times the rate of inflation (1.8 percent annually).
Nationally, per student education spending grew 2.6 percent a year. By definition, Illinois grew its education spending far faster than all of its neighboring states. Kentucky and Iowa managed to grow per student spending at the same rate as the national average since 2007 – 36 percent – but the remaining states all grew at slower paces. Wisconsin grew its spending 23 percent over the period, while Indiana grew just 16 percent. Inflation over the entire period totaled 23 percent.
 Illinois 2019 per student spending
Illinois’ per student spending surpassed the spending of its neighboring states in 2010. Since then, the gap has grown significantly wider.
In 2019, Illinois spent $16,227 per student – more than any neighbor, the national average, or any other state in the Midwest. Illinois spent 16 percent more per student than North Dakota ($14,004), 27 percent more than Michigan ($12,756), 45 percent more than Missouri ($11,200), and 60 percent more than South Dakota ($10,139).
 Illinois’ significant gap in spending is not due solely to high-spending, wealthy districts. Even Illinois’ neediest districts, on average, spent more per student than the overall average in other Midwest states.
Illinois’ neediest districts (the 306 districts designated Tier 1 under Illinois’ evidence-based funding model) spent an average of $15,216 per student in 2019, more than the average per student spend in every other Midwest and neighboring state. (And even when Chicago Public Schools system is stripped from the calculations, the average Tier 1 per student spend, at $14,853, is still higher than all other Midwest states.)
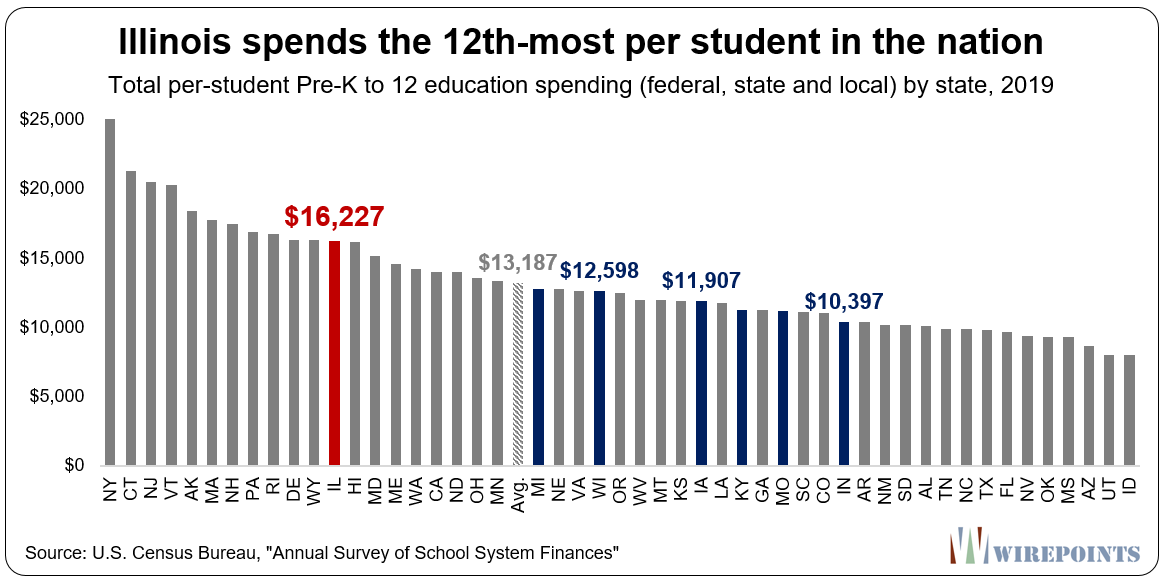
 When compared to all 50 states, Illinois spent the 12th-most on education per student in 2019. That’s a marked increase from 2007 when Illinois’ spent $9,555, the 20th-most of any state. (When cost-of-living is factored in, Illinois’ 2019 per student spend was the 8th-most in the nation.)
 Illinois’ spending growth is not just due to pension costs
Illinois’ education establishment will want to attribute the increase in education spending largely to the growth in contributions to teacher pensions, but the reality is Illinois’ spending growth would still be one of the nation’s biggest even if pension contributions were stripped out entirely.
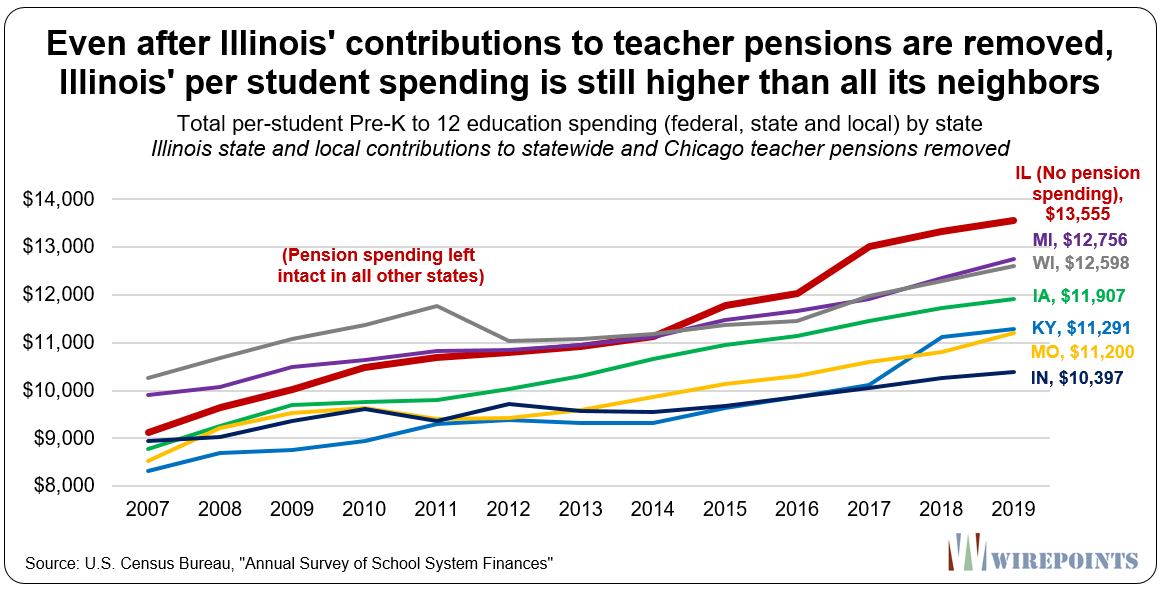
Even after removing pension contributions from Illinois’ expenditures – while leaving pension spending intact in all other states – Illinois’ per student spending still grew the 10th-most in the nation (49 percent) between 2007 and 2019.
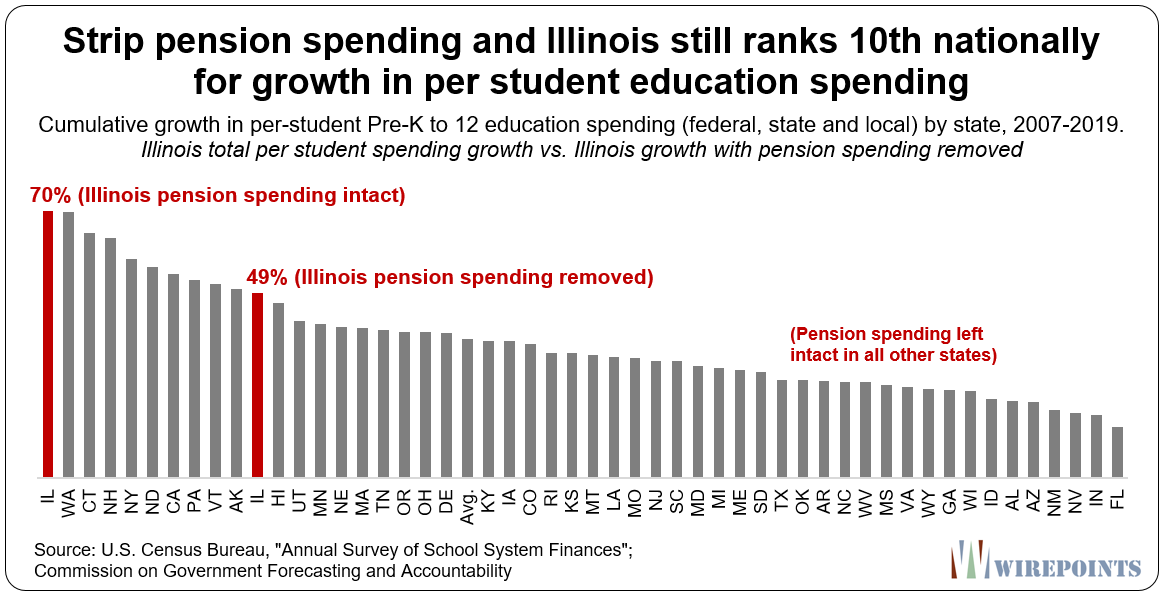 Illinois also outspends every one of its neighbors. Excluding state and local pension contributions, Illinois’ per student spending in 2019 drops to $13,555, still 6 percent higher than Michigan’s per student spend and 30 percent higher than Indiana’s.
 Resources up, enrollment down
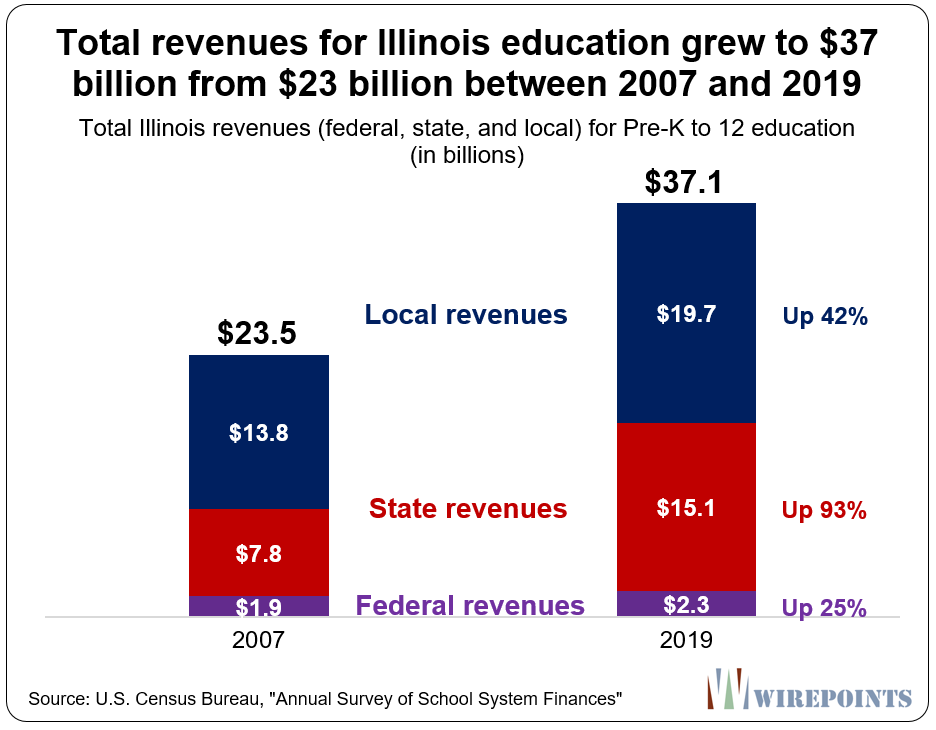
All three sources of Illinois education funding – federal, state and local – increased between 2007 and 2019.
State sources were up 93 percent over the period, growing to $15.1 billion from $7.8 billion. Local resources, driven mainly by property taxes, were up 42 percent, growing to $19.7 billion from $13.8 billion. Federal revenues were up 25 percent, growing to $2.3 billion from $1.9 billion. Inflation increased 23 percent over the same period.
 All that additional money has been added to a system that’s serving fewer and fewer students.
Illinois enrollment has shrunk by more than 150,000 students between 2007 and 2019. That’s a decline of more than 7 percent – the 10th biggest percentage loss in the nation.
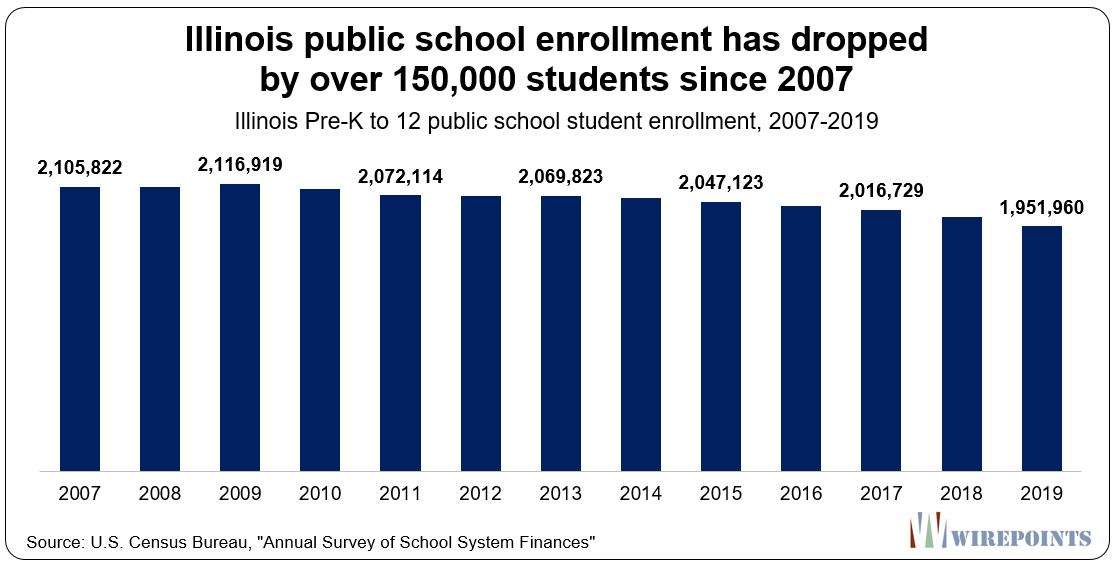 In contrast to Illinois, there are eight states that have experienced double-digit growth in student populations. Some, like Utah (19 percent) and Texas (13 percent) have managed to keep per student spending low ($8,014 and $9,827, respectively) despite their rapid growth.
Achievement has flatlined despite Illinois’ increased spending
Illinois’ significant growth in education spending has done nothing to improve student achievement. Illinois’ National Assessment of Educational Progress (NAEP) math and reading scores for both fourth and eighth grade have remained effectively flat since 2007.
The average math score for fourth-graders was 237 in 2007. In 2019, it was the same. In reading, scores declined to 218 in 2019, down from 219 in 2007.
Illinois scores for eighth-graders have done a little better. Student math scores improved to 283 from 280 in 2007. Reading scores are up two points to 265.
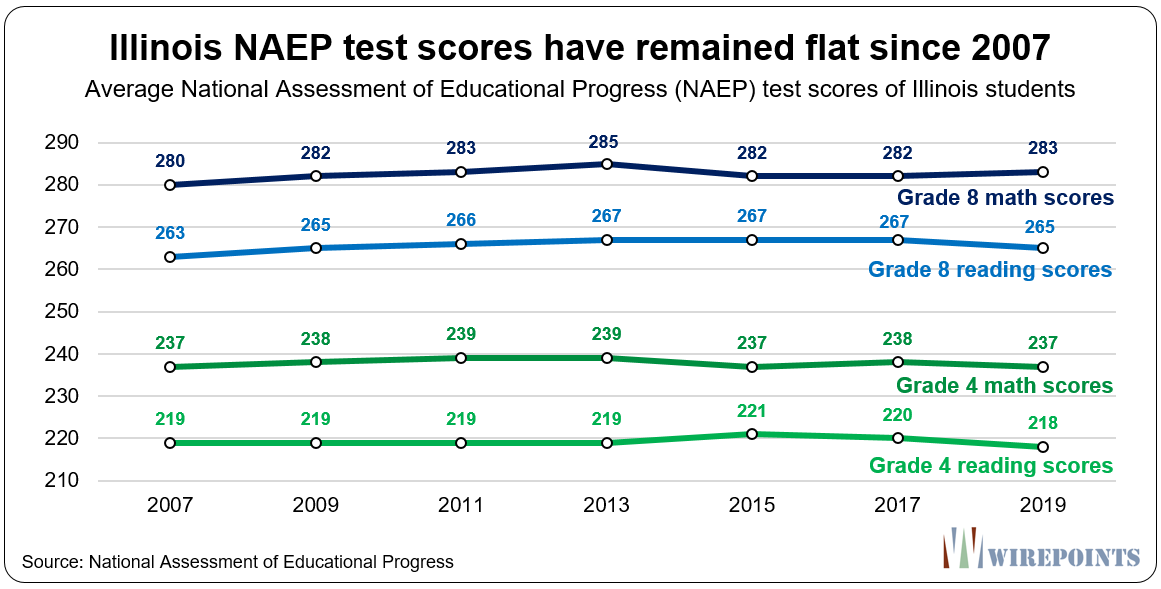 All student scores, it should be noted, are down compared to 2013 – the same year Illinois began to grow education funding at a more rapid pace compared to previous years.
It’s not as if Illinois scores have plateaued at high levels. Quite the opposite, in fact.
Illinois’ NAEP scores are mostly lower when compared to its neighbors. Indiana spends far less on education per student than Illinois does, but Indiana’s results are better across the board. Ditto for Wisconsin, Missouri, Iowa and Kentucky, where students have also largely outperformed their peers in Illinois.
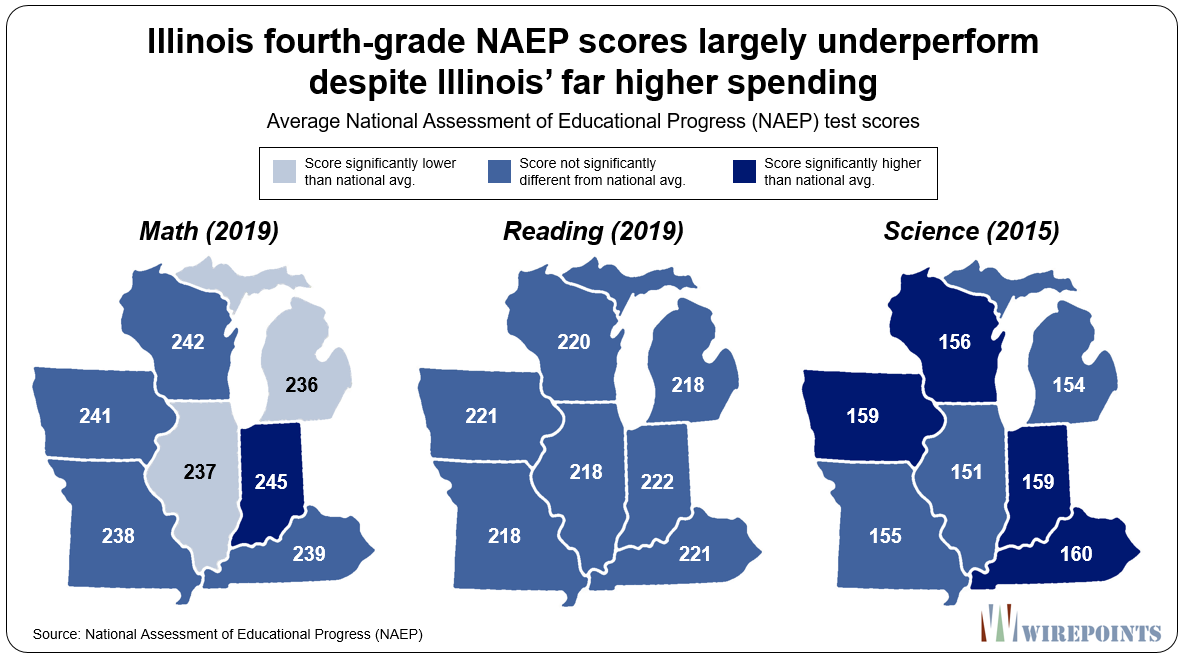 The numbers in red in the graphic below show where Illinois underperforms compared to its neighbors. In fourth-grade math, Illinois fares worse in NAEP proficiency versus all its neighbors except Michigan. In fourth-grade reading, it’s the same story. And in science, Illinois scores worse than all its neighbors in both grades.
 Illinois needs reforms, not more spending
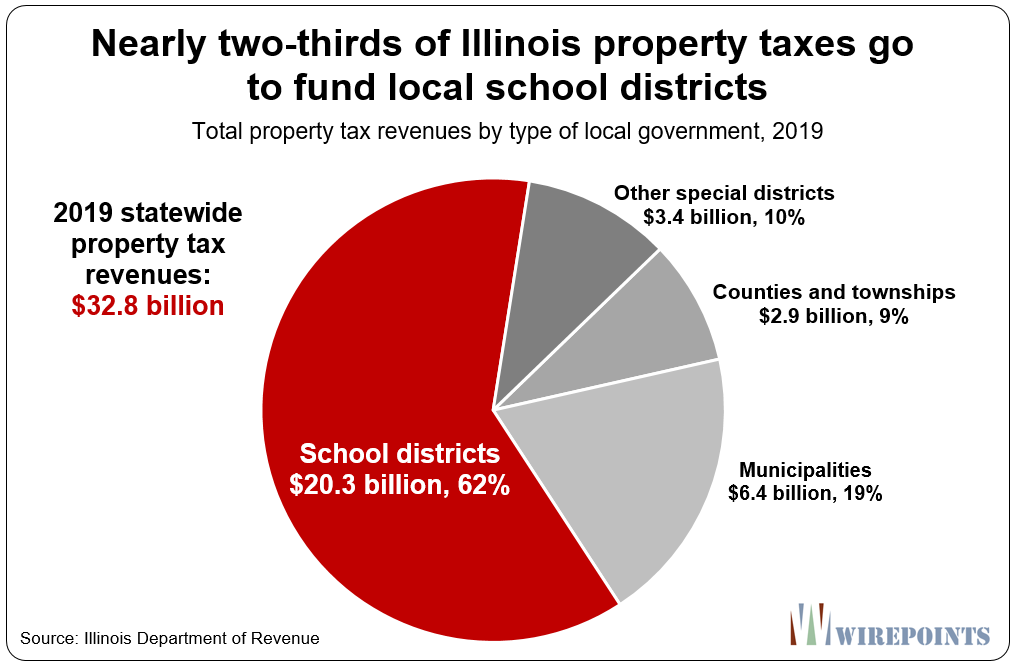
Illinoisans pay some of the nation’s highest taxes to fund the state’s education system. Residents are burdened with the nation’s 10th-highest state/local taxes, including the nation’s 2nd-highest property taxes. Billions of those state/local taxes, including nearly two-thirds of local property taxes, pay for school district costs (See Appendix B).
 Residents are taxed out, and yet lawmakers want even more taxes to fund education.
But if there is one clear takeaway from the data above, it’s that Illinoisans have already poured billions of additional dollars into Pre-K to 12 education with little to show for it regarding student achievement.
Rather than squeeze more tax dollars out of Illinoisans, lawmakers should find better ways to spend the education money Illinois already has. They can start by consolidating school districts, cutting back on various employment perks and reforming pensions – starting with a pension amendment to the state’s constitution.
Appendix A.
 Appendix B.
 Audio and summary
  If this bill passes, say goodbye to local control over all Illinois parks and expect to see open drug and alcohol use, needles, no sanitation and fire hazards, but no ordinary park users.
CTU and IFT are the bulk of the problem. Bust the teachers unions and provide school vouchers for all. Problem solved.
Moral of the story: Once you get a large number of people doing stupid things (like empowering thieves), they’ll keep on doing it for a long as possible: It’s easier than admitting that they were suckered.
Every young person in the state should leave.
FWIW, I’m not the same James defending unions below.
Wisconsin has done more to diminish the power of public unions, including teachers unions. It is also a right to work state. Collective bargaining rights were stripped. They have a public union certification requirement. Apparently, the republicans in Wisconsin didn’t take to public unions.
Long live slave wages in such states; the upper echelons of society love it!
Unions for skilled private labor are fine, as they’re constrained by market forces.
Unions for public sector employees are a leach on society. The public sector union is there to simply gain from the other side, ie. the taxpayer.
Kennedy failed us all in cracking open the door to these useless grifters.
Alrighty, then
I wonder which teacher taught them how to twerk on the hood of a police car?
Are the savages that were running amok in the loop over the weekend typical of what chicago public schools are putting out?-I know,I know ,more tax payer money will solve EVERYTHING huh?
Personally, I’d say its more due to what their parents are putting out, but to a lesser extent what you say has merit, too.
holy cow james,i totally agree!-its refreshing that you and i agree on something for once!-thank you
Today’s parents are also the product of a broken education system. Is it a surprise that they are ineffective as parents?
Public education took a hard left turn in the late 70’s. We are living with the results. NEA and AFT are advocating for doubling down on this massive failure, judging by the results of their vote to advocate for CRT.
There was a significant shift in Amercan values when “the Woodstock generation” of the 1960’s became adults and voters. The prolonged sucking despair and tragedies of the Vietnam War are some of the root causes for their values being changed frim those of earlier generations.
I work as a middle school aide in a fairly affluent school district. To me, the amount of money spent per pupil makes no difference in the child’s desire to excel in school. They either want it, or they don’t. Let’s back off the spending and devise a plan to motivate kids who truly don’t care about school. Easier said than done, I know.
You’ve said it all! The amount of money devoted to the task is a factor, but there are numerous other human factors involved here where becoming truly educated is a possibility or not. “You can lead a horse to water, but….”
Yes, public schools have to take in their own matriculated students year after year. Special needs are covered with seperate funding.
Yes, and that’s likely a good thing. But, there are those ever-present other human factors I addressed that are always present, some being positive where such things thrive but many others being negative towards achieving academic success in the classical sense for the more usual cases.
More than half of the school age population in many areas of Illinois attend private school. Compare the private school cost with academic achievement, and you will more plainly see the fraud that is public education in Illinois. Fair minded folks would consider what is happening in Illinois with public education to child abuse.
In the case of private schools you always have a selected level of parents and students with the parents motivated by money to spend it wisely and in terms of wanting to motivate their children to do well enough to justify that extra expense in their lives. Public schools HAVE to take all students who are of a certain age regardless of circumstances, motivation, behavior, ability to read/write/listen, etc. In short you are not comparing like sets of parents nor students. They are greatly different in ways that matter in terms of truly be able to be “educated” in the… Read more »
You correctly describe the outcome — a privileged group that will maintain its privileges because private schools work (relative to public schools). There are also places with great public schools (e.g., Bellevue, WA) but that’s an affluent area filled with high-tech and other professionals. What’s worse is that public schools do increasingly less in educating children even though they spend ever-more money on it. So making excuses for them begins to ring hollow. We could also point to unions and seniority and administrative bulk as contributing to the problems. If it works, don’t fix it. But when decades of urban… Read more »
There is a MULTITUDE of problems with the public schools across America with many (most?) urban centers seeing the worst of it. Many seem to think the “fix” is easy. It isn’t! If it were easy it would have occurred a long, long time ago. If you want your child to be successul you have to teach him/her to strive in whatever he/she does from day #1 in that life, and follow-through to assist that in happening. Children who grow up without direction, hope and gentle follow-through from parents are set behind early in the game and almost never catch-up… Read more »
Clearly you are correct. Yet I graduated from an urban public school in the late 50’s and got BA, MA and JD degrees from top universities. I had four years of Latin and math and other rigorous subjects. Yes I had an intact family who provided food, shelter etc. in modest but sufficient quantity and, more importantly, were there to catch me if I screwed up. The city that provided me with K-12 education is now an urban wreck full of violence and corruption and terrible public schools. I doubt much of that can be blamed on the teachers’ union,… Read more »
Personally I like (or think I like) the old European model where students take achievement tests along the way that are weeding-out mechanisms. Here all parents seem to think their children are going to be the cream of the crop while the child’s performance and attitude shows no sign of it. Thus, we spend way, way too much public money on children who simply don’t aspire to do what’s needed academically in many of the courses offered. There are exceptions, and you were an obvious one. We can’t economically educate all children for jobs where they haven’t sufficient interest, work… Read more »
You touch on a subject that tends to make me very cranky! That is the compulsion to promote those who are not at grade level in their achievement. This also is due to numerous factors, most beyond the control of the student. Of course, students have the capacity to recover and succeed. My son took until age 38! So we can’t be arbitrary about when we shunt them to a side track. Private schools can afford to give the needed individual attention and public schools aren’t funded to that level. The family is of particular importance as I observe with… Read more »
McHenry County public schools typify the data cited above. Annual spending per pupil is near $17,000 and standard test scores indicate mediocrity or worse. In Woodstock, over 9% of household income is taken for property taxes (compare to mean in America well below 4%). This leaves nothing in the household budget for non-public sector workers, who DO need to pay for their own post-age-55 healthcare and DO need to save for their own retirements (which cannot begin until a decade later than teachers). President’s visit to McHenry County today is supposed to address the concerns of economically stressed households. Yet… Read more »
Those in the world of “widget work,” tend to think that doubling a resource logically means you’ll double the number of goods produced. Dealing with the public in a social setting such as schooling and, perhaps, even otherwise is a whole different ball game. Doubling the amount of money devoted to it might bring some improvements here and there, but it definitely will not double the academic gains of the general student population. Issues well beyond funding resources are at play to retard that level of predictable progress. Educational progress depends on funding to an extent but its not a… Read more »
Listen closely Illinois residents and you can hear me (a new Tennessee resident) laughing as I count all the money I am now saving. “One Thousand, two thousand, three thousand, ……”
Remember, you live in Illinois by choice. I can only assume that since you are still there, the pros outweigh the cons.
But do parents in Illinois want education outcomes to change, or are they getting the results they want?
Well, there are parents mostly only in the biologial sense, then there are parents in the wider sense of that term. The former want primarily a free baby-sitting service predominantly while the latter have greater expectations for their children. Guess where each group tends to reside in greater proportions.
This final report details the Illinois‘ 2020 Census efforts and outcomes as well as,importantly, while the state’s average self-response rates consistently ranked among. All that and more has served to siphon away billions in direct funding for classrooms and Illinois’ neediest districts.
Dan – your statement is hard to follow – we all make typos and truncated sentences occur in this kind of medium. Can you restate what you mean?