
Part 2: Illinois Pensions - Overpromised & Overgenerous
A fundamental problem with the state pension protection clause is its asymmetry. Illinois lawmakers enacted strict constitutional language to ensure that pension benefits would never be diminished, but they didn’t create a mechanism to control or limit the growth in those benefits.
What few spending controls they did put in place, such as the balanced budget amendment, have been entirely ignored. Lawmakers failed to contemplate that pension benefits could be used by future legislatures for political gain or that benefit growth could markedly outstrip the ability of its residents to pay for them.
With no limits in place, accrued pension liabilities – the total sum of what’s owed in future pension benefits at any one time – have grown far faster than in most states and have inflicted serious damage to Illinois’ economy, resident incomes and public worker retirement security.
This second part of Wirepoints’ four-part series outlines how those overpromised benefits, and not underfunding, have been the real cause of Illinois’ crisis. It also details how overly generous pension and retiree health insurance benefits are a driver of that overpromising.
Illinois’ pensions are overpromised, not underfunded
Illinois’ pension crisis is usually blamed on “underfunding.” The term implies that Illinois’ legislature failed systematically to pay into the five state-run pension systems with taxpayer contributions, resulting in massive shortfalls.
But an analysis of the state’s pension data reveals that too few contributions into pensions hasn’t been the real problem. More than enough funds have been poured into the systems. Instead, the true cause of Illinois’ underfunding has been the dramatic and persistent growth in total pension benefits promised.
Wirepoints found that Illinois’ accrued liabilities have exploded over the past three decades, growing far faster than what the state’s economy, its tax base and personal incomes could ever have afforded. Illinois’ pension promises have grown more than those in almost every other state since 2003, fueling a fiscal crisis that’s unparalleled nationwide.
Wirepoints’ findings are based on an analysis of Illinois pension and economic data stretching back to 1987, as well as 50-state pension plan data from 2003-2017 collected by Pew Charitable Trusts.
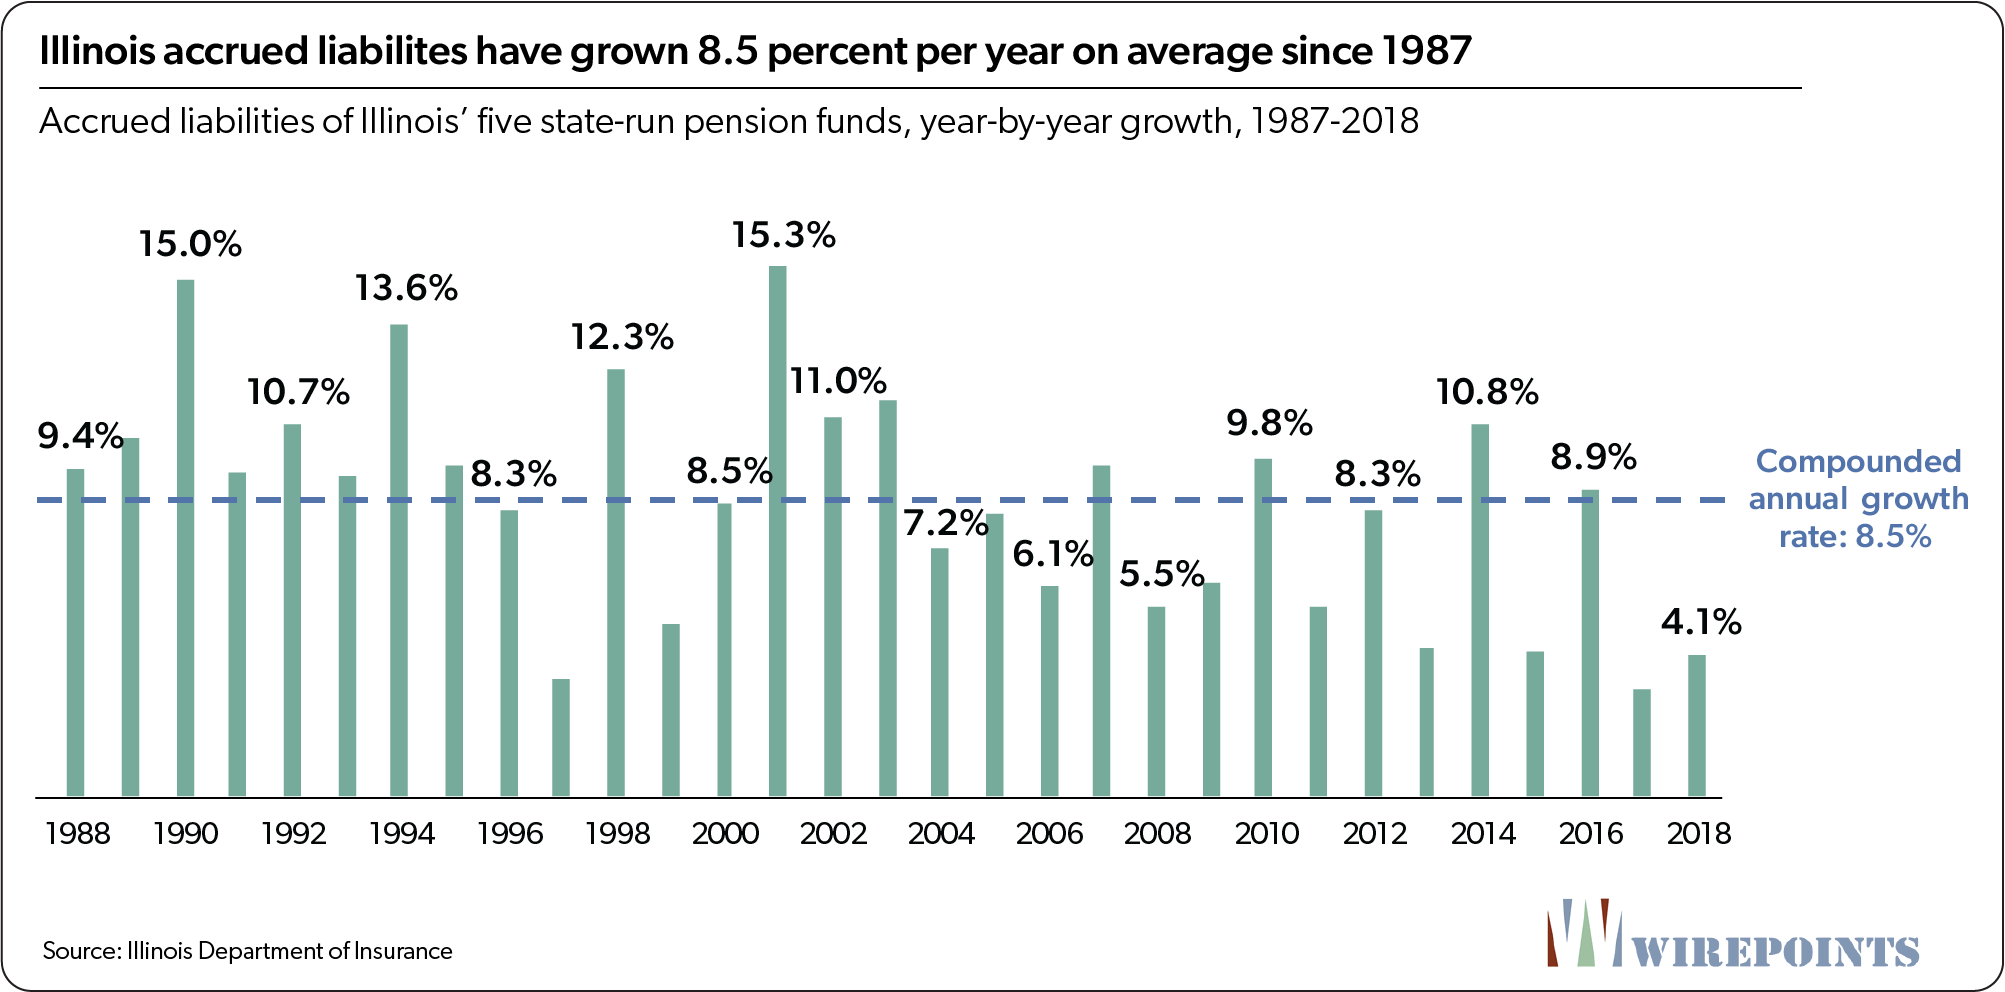
The accrued liabilities of the state’s five state-run pension funds have grown at a compounded rate of 8.5 percent a year since 1987, according to data from the Illinois Department of Insurance. Those liabilities grew by more than 10 percent annually for 11 of those years, resulting in stunning compounded growth.

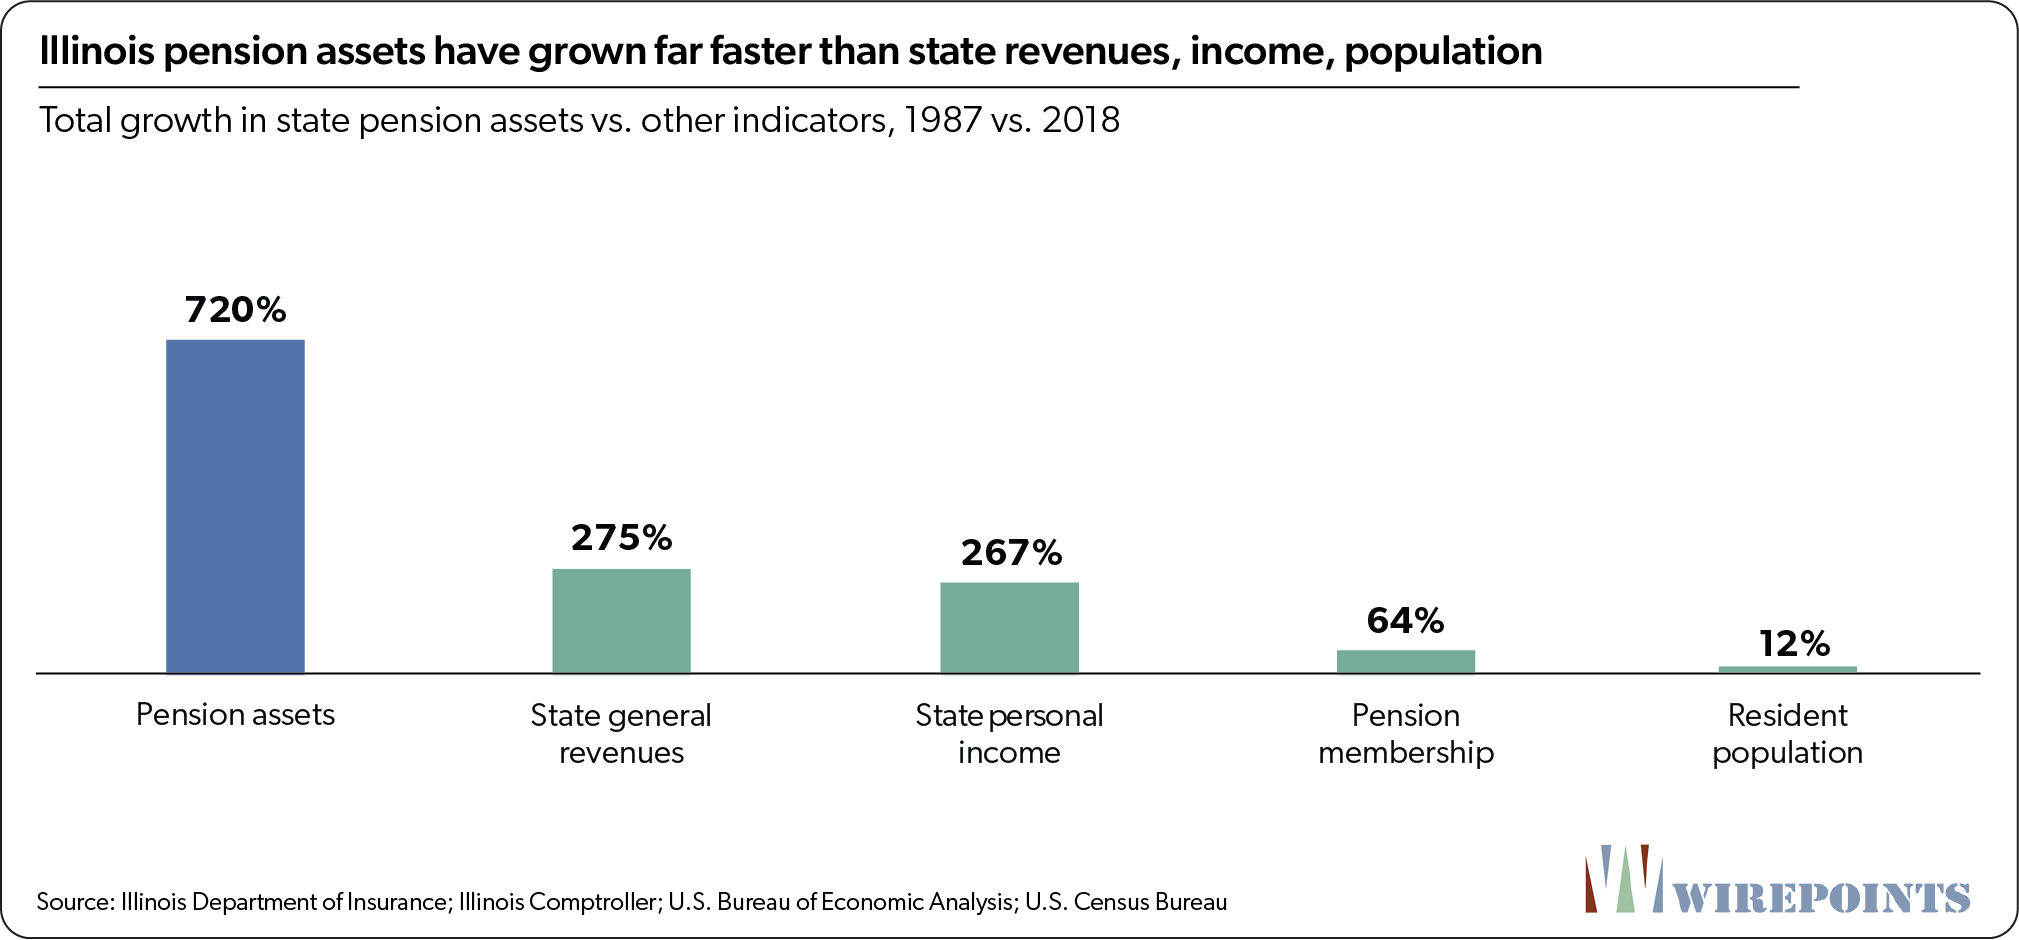
That’s resulted in a total increase of 1,146 percent over the entire 31-year period. No other state metric comes even remotely close to matching that kind of growth. The state’s personal income, a proxy for GDP, grew just 267 percent over the same period and the state’s general revenues were up 275 percent.
Overall, total benefits have grown four to nine times faster than other key growth metrics.
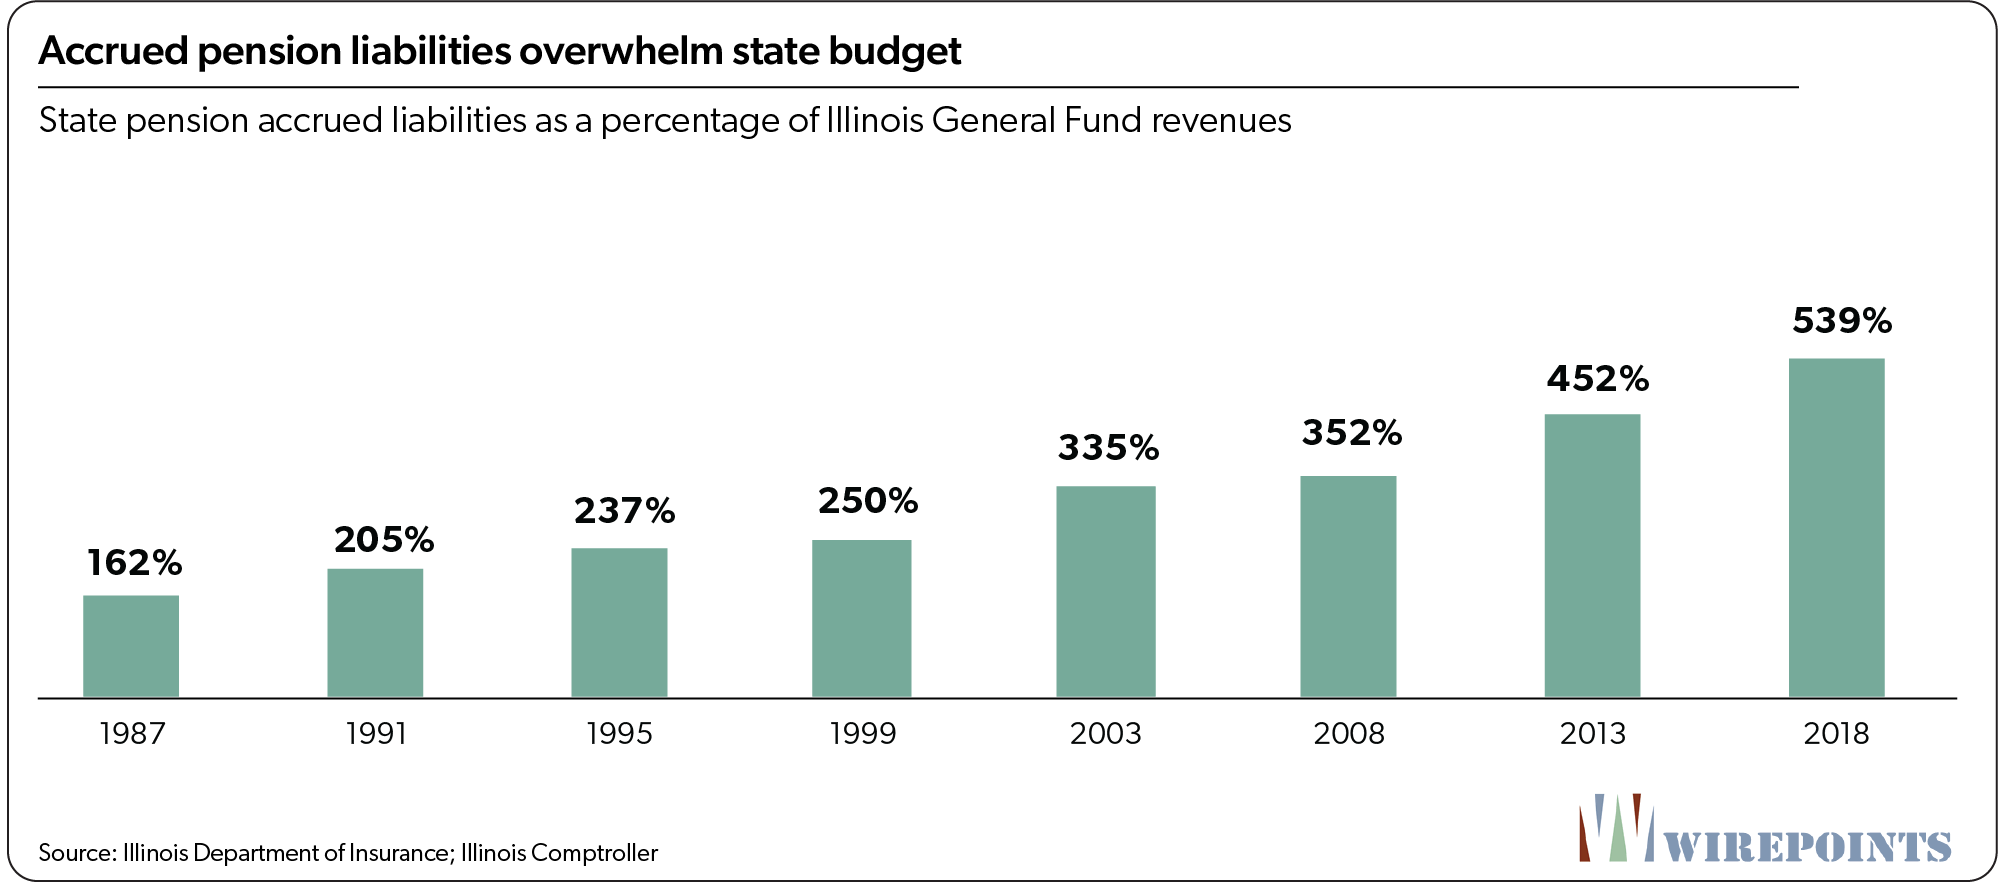
Another way to measure accrued liability growth is to compare it to the state’s tax base over time. Thirty years ago, the state’s obligations to active workers and retirees amounted to 162 percent of the state’s general revenues. Today, those promises have ballooned to more than 500 percent of revenues.
That’s the result of benefits growing 8.5 percent a year since 1987, far outstripping the rapid 4.4 percent average annual growth of state general revenues over the same period.
With pension benefits outpacing every measure of Illinoisans’ ability to pay for them, it’s no wonder Illinois is in crisis, its taxpayers are fatigued, and core government services are being slashed.

Illinois growth in accrued liabilities: a national outlier
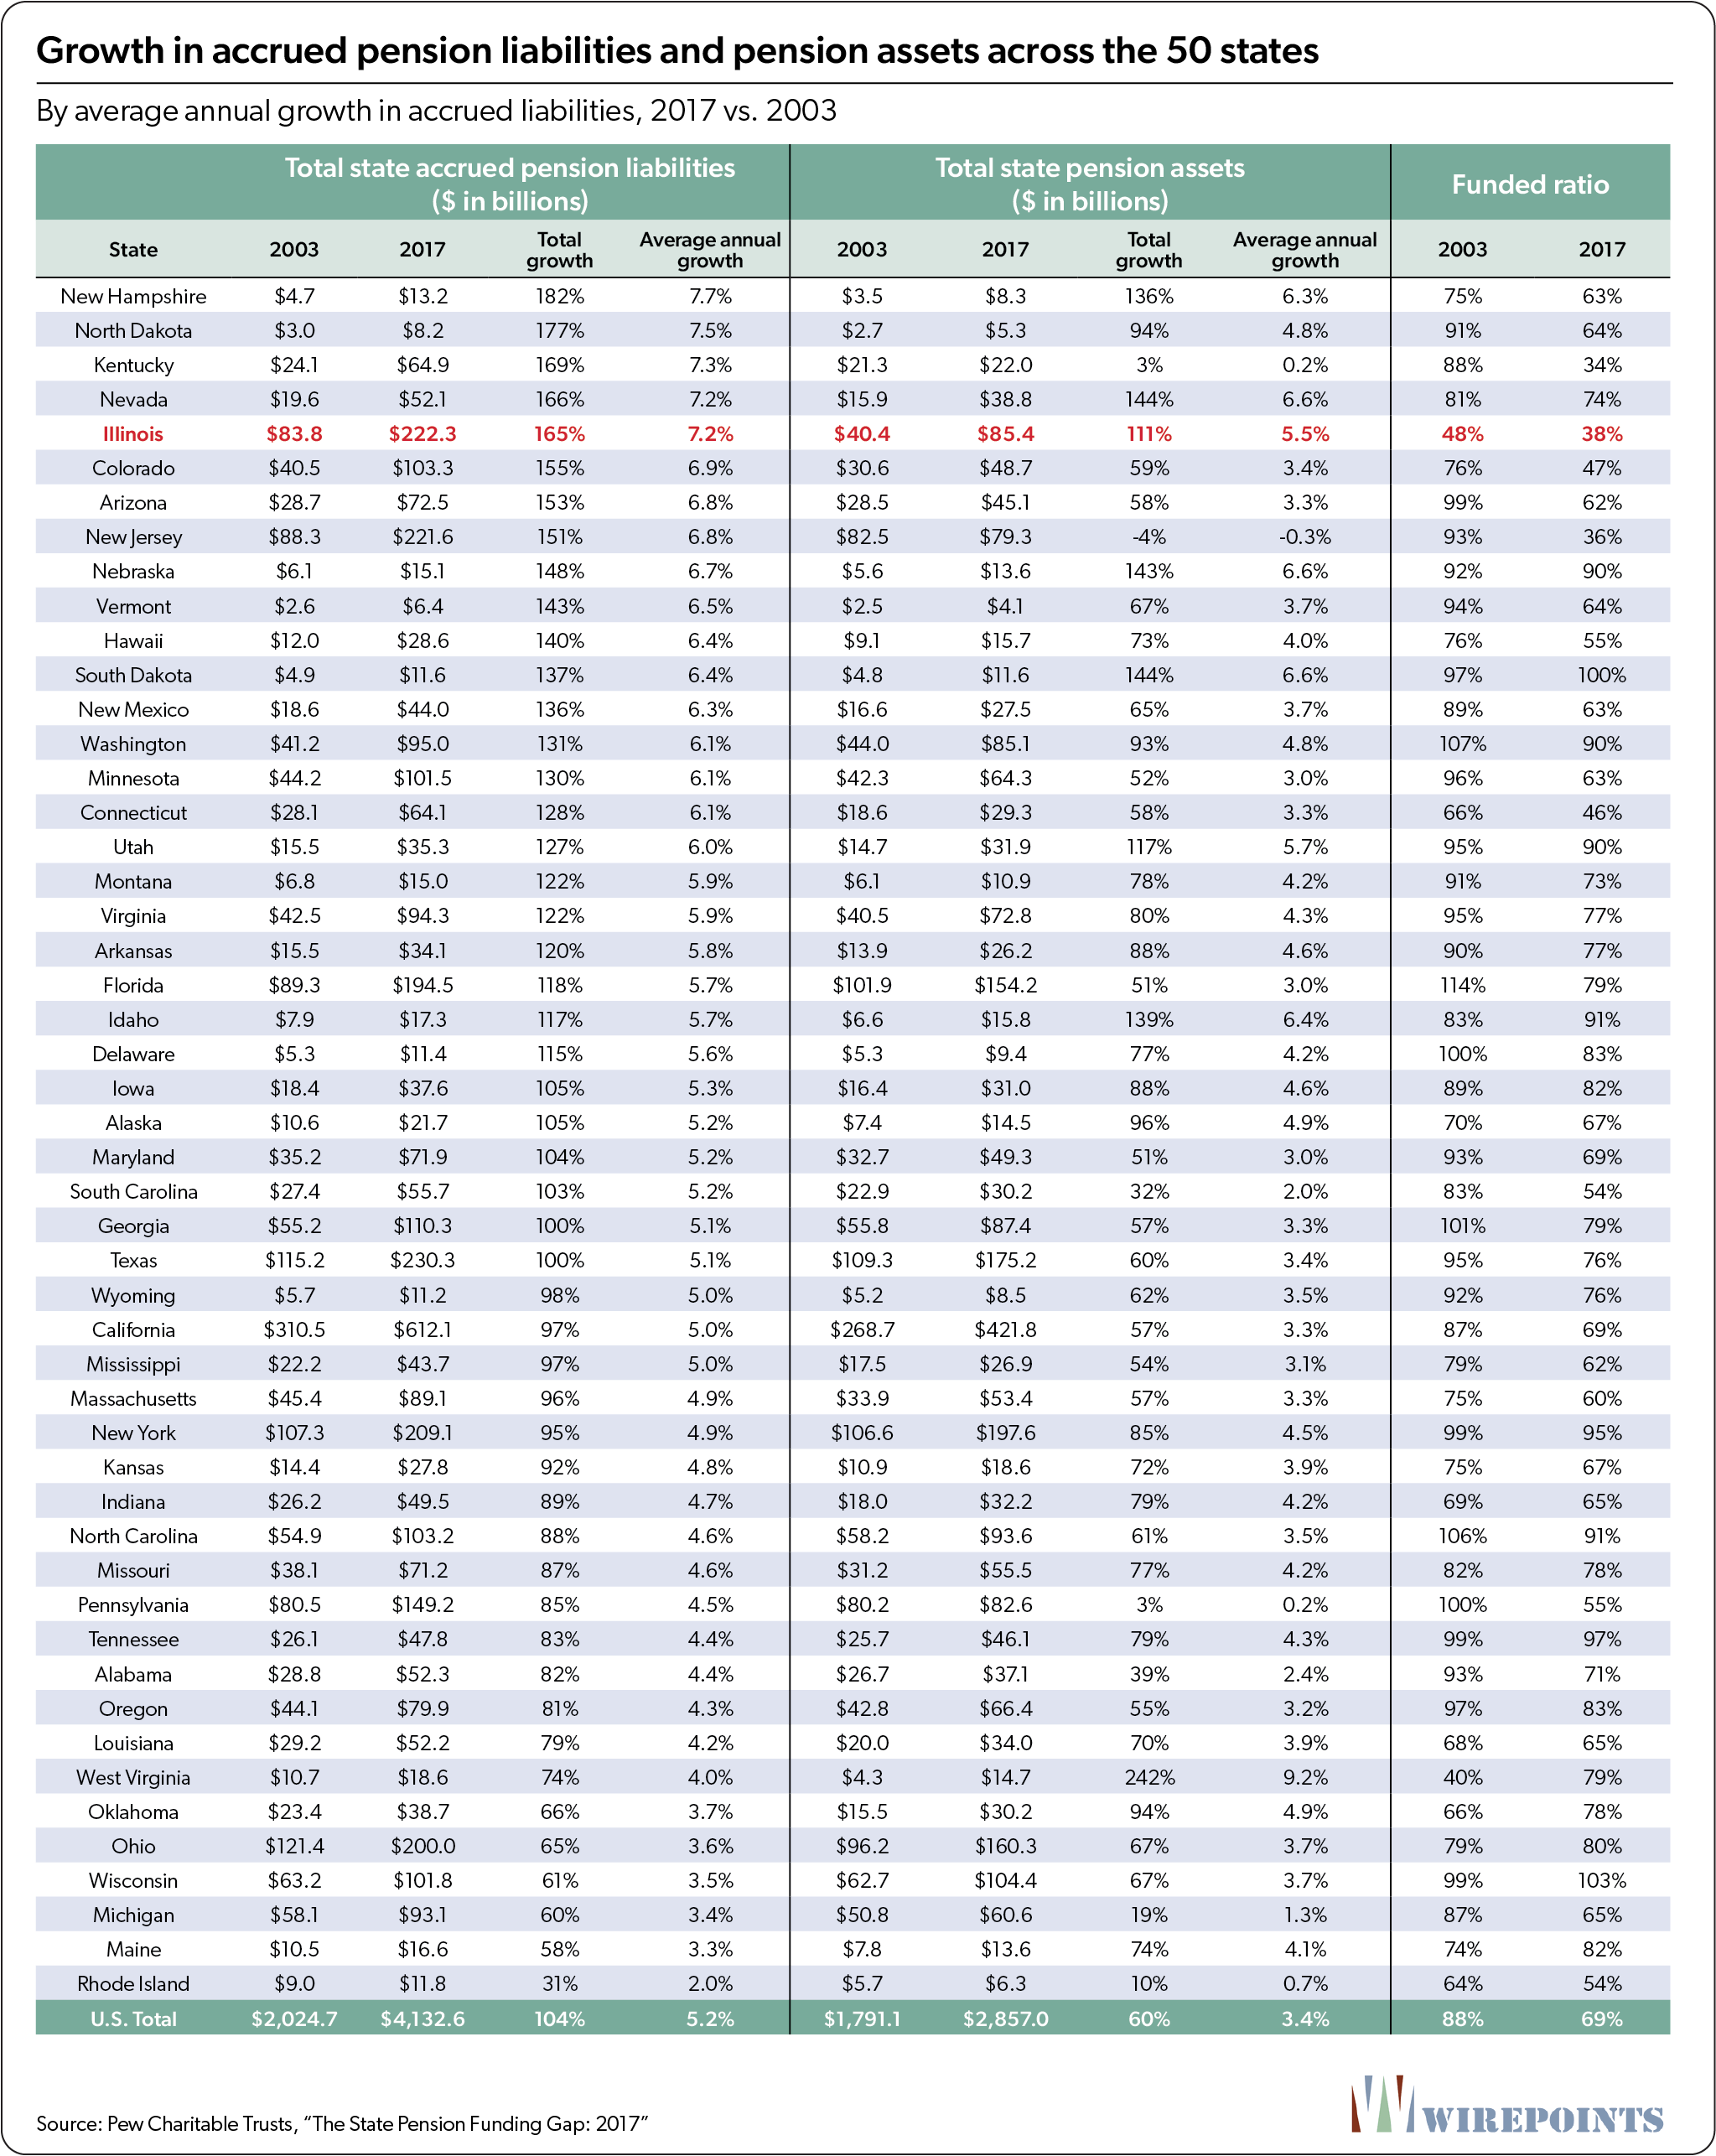
A 50-state comparison over time reveals just how much of an outlier Illinois’ pension promises really are. Wirepoints compared the growth of Illinois’ accrued liabilities to those of other states using 2003-2017 data compiled by Pew Charitable Trusts. Comparable state-to-state data over a longer period was not available.
During that 14-year period, Illinois’ accrued liabilities grew 7.2 percent annually, the 5th-fastest pace of any state in the country. Illinois’ growth rate was faster than the national average of 5.2 percent and far faster than the growth of all of its neighbors except Kentucky. (See Appendix A for more details.)

In contrast, states like Wisconsin, Maine, Michigan, Oklahoma and Ohio kept the growth of their pension obligations under 4 percent per year.
While a 2-3 percent differential in growth rates may not look like much, over a long period the compounding effect can be dramatic. Had Illinois’ pension benefits simply grown at the national average of the Pew data back in 1987, Illinois’ plans would be fully funded today based on official assumptions.
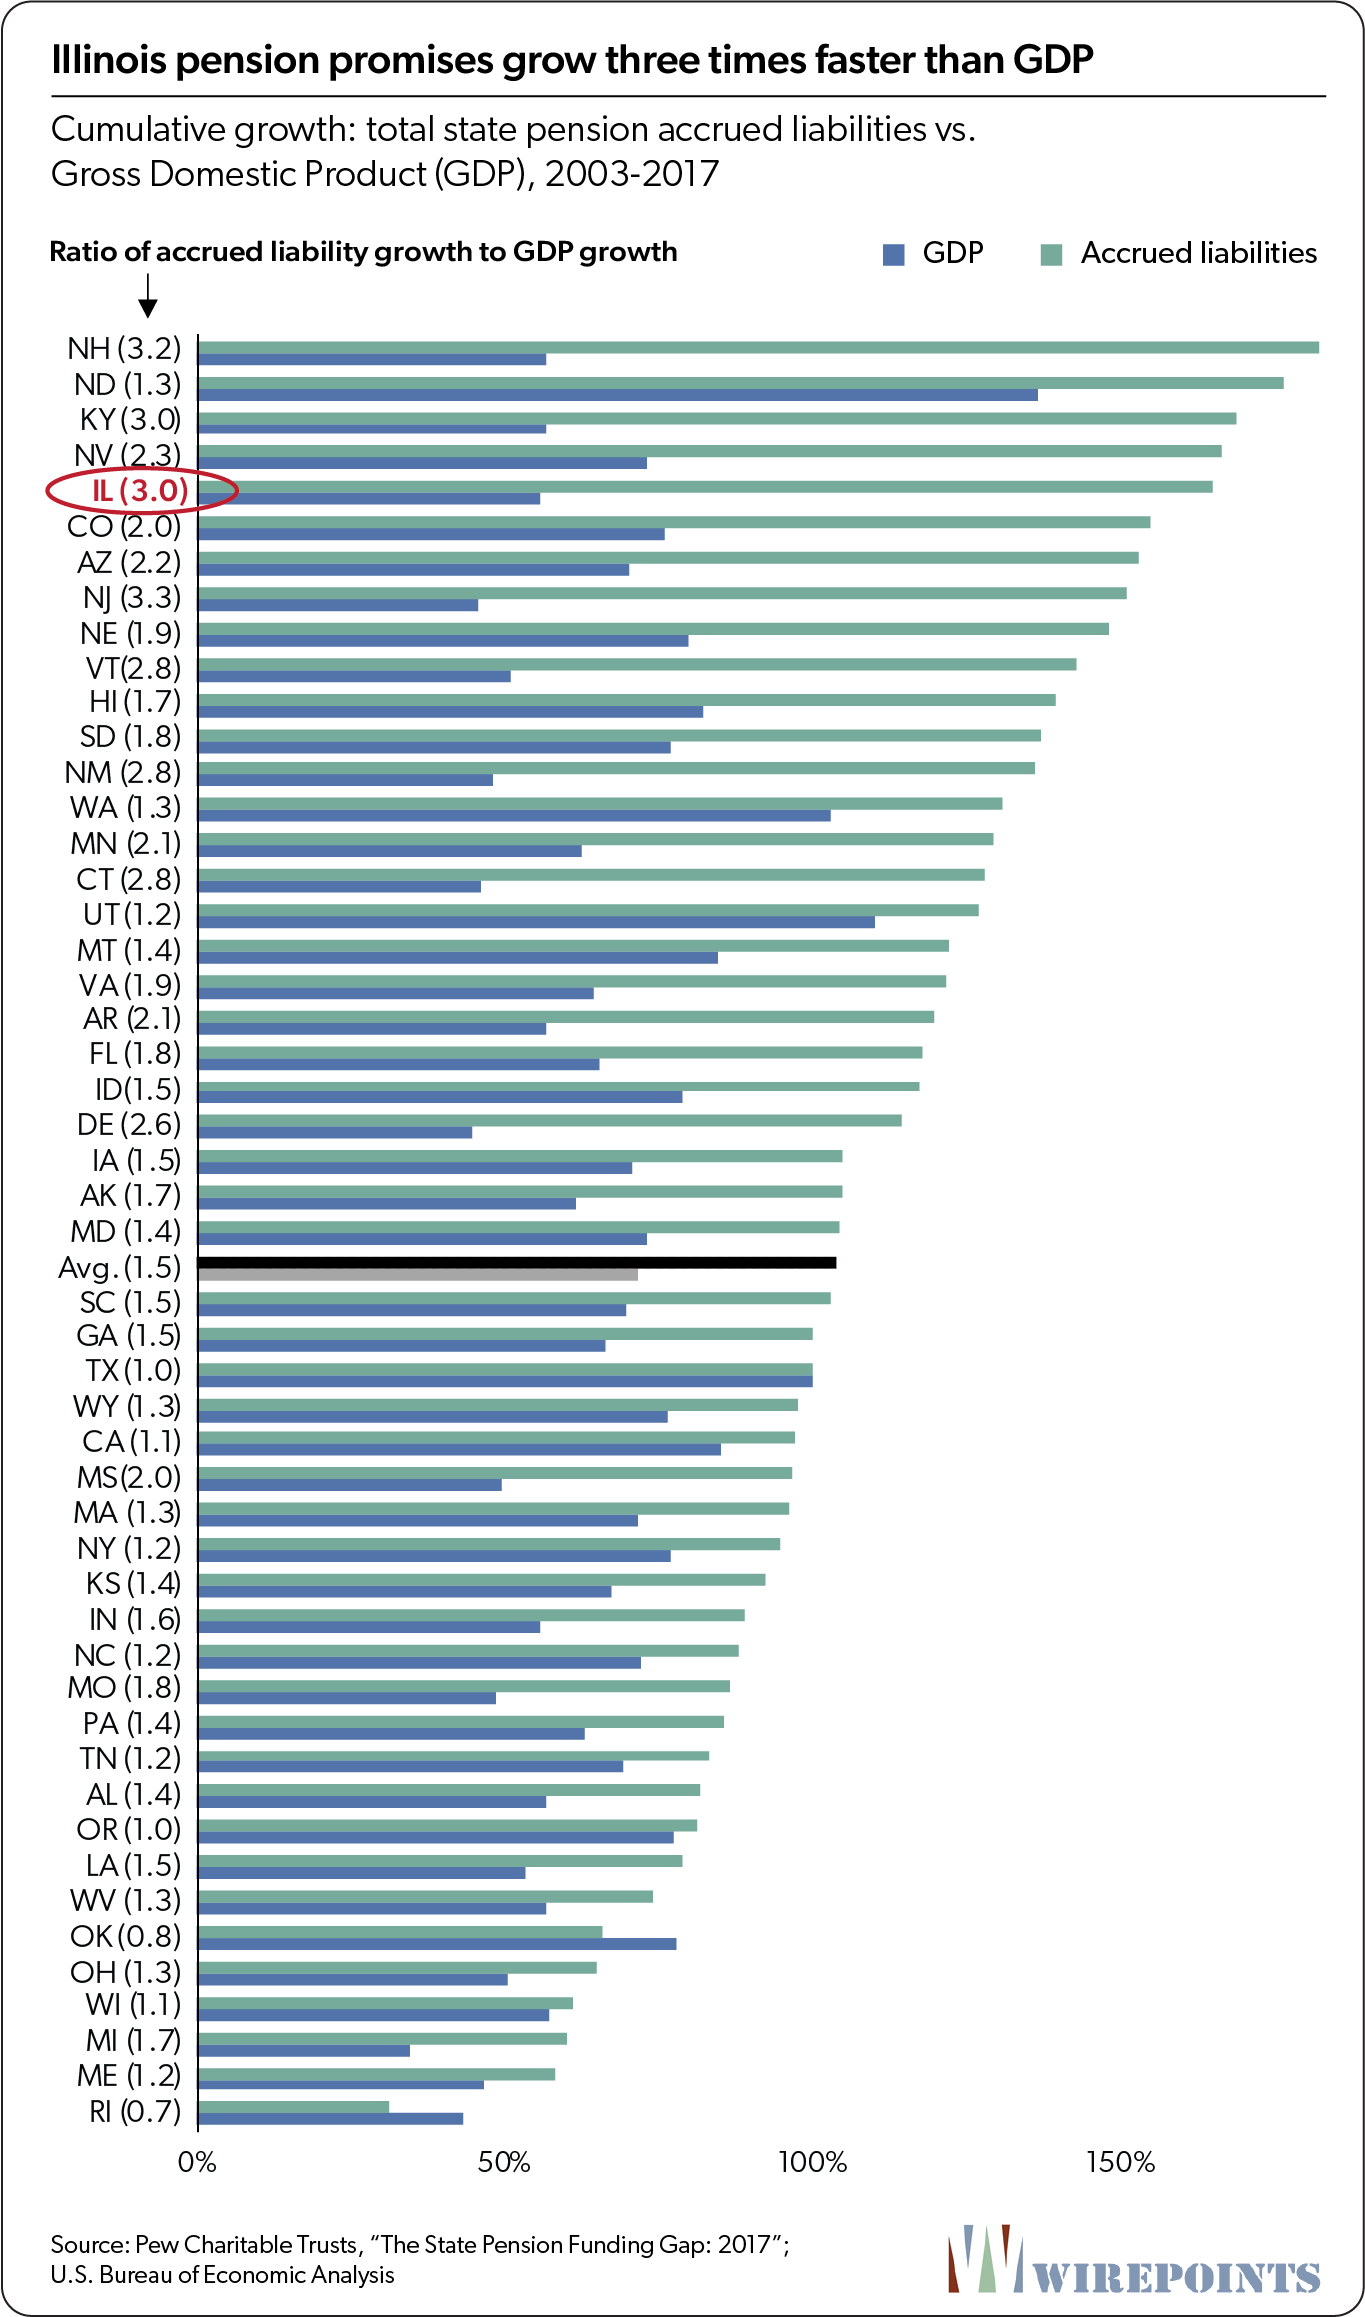
Too much growth in pension liabilities can also overwhelm a state’s economy. Some states have seen the growth in their promises far exceed the growth in their GDPs.
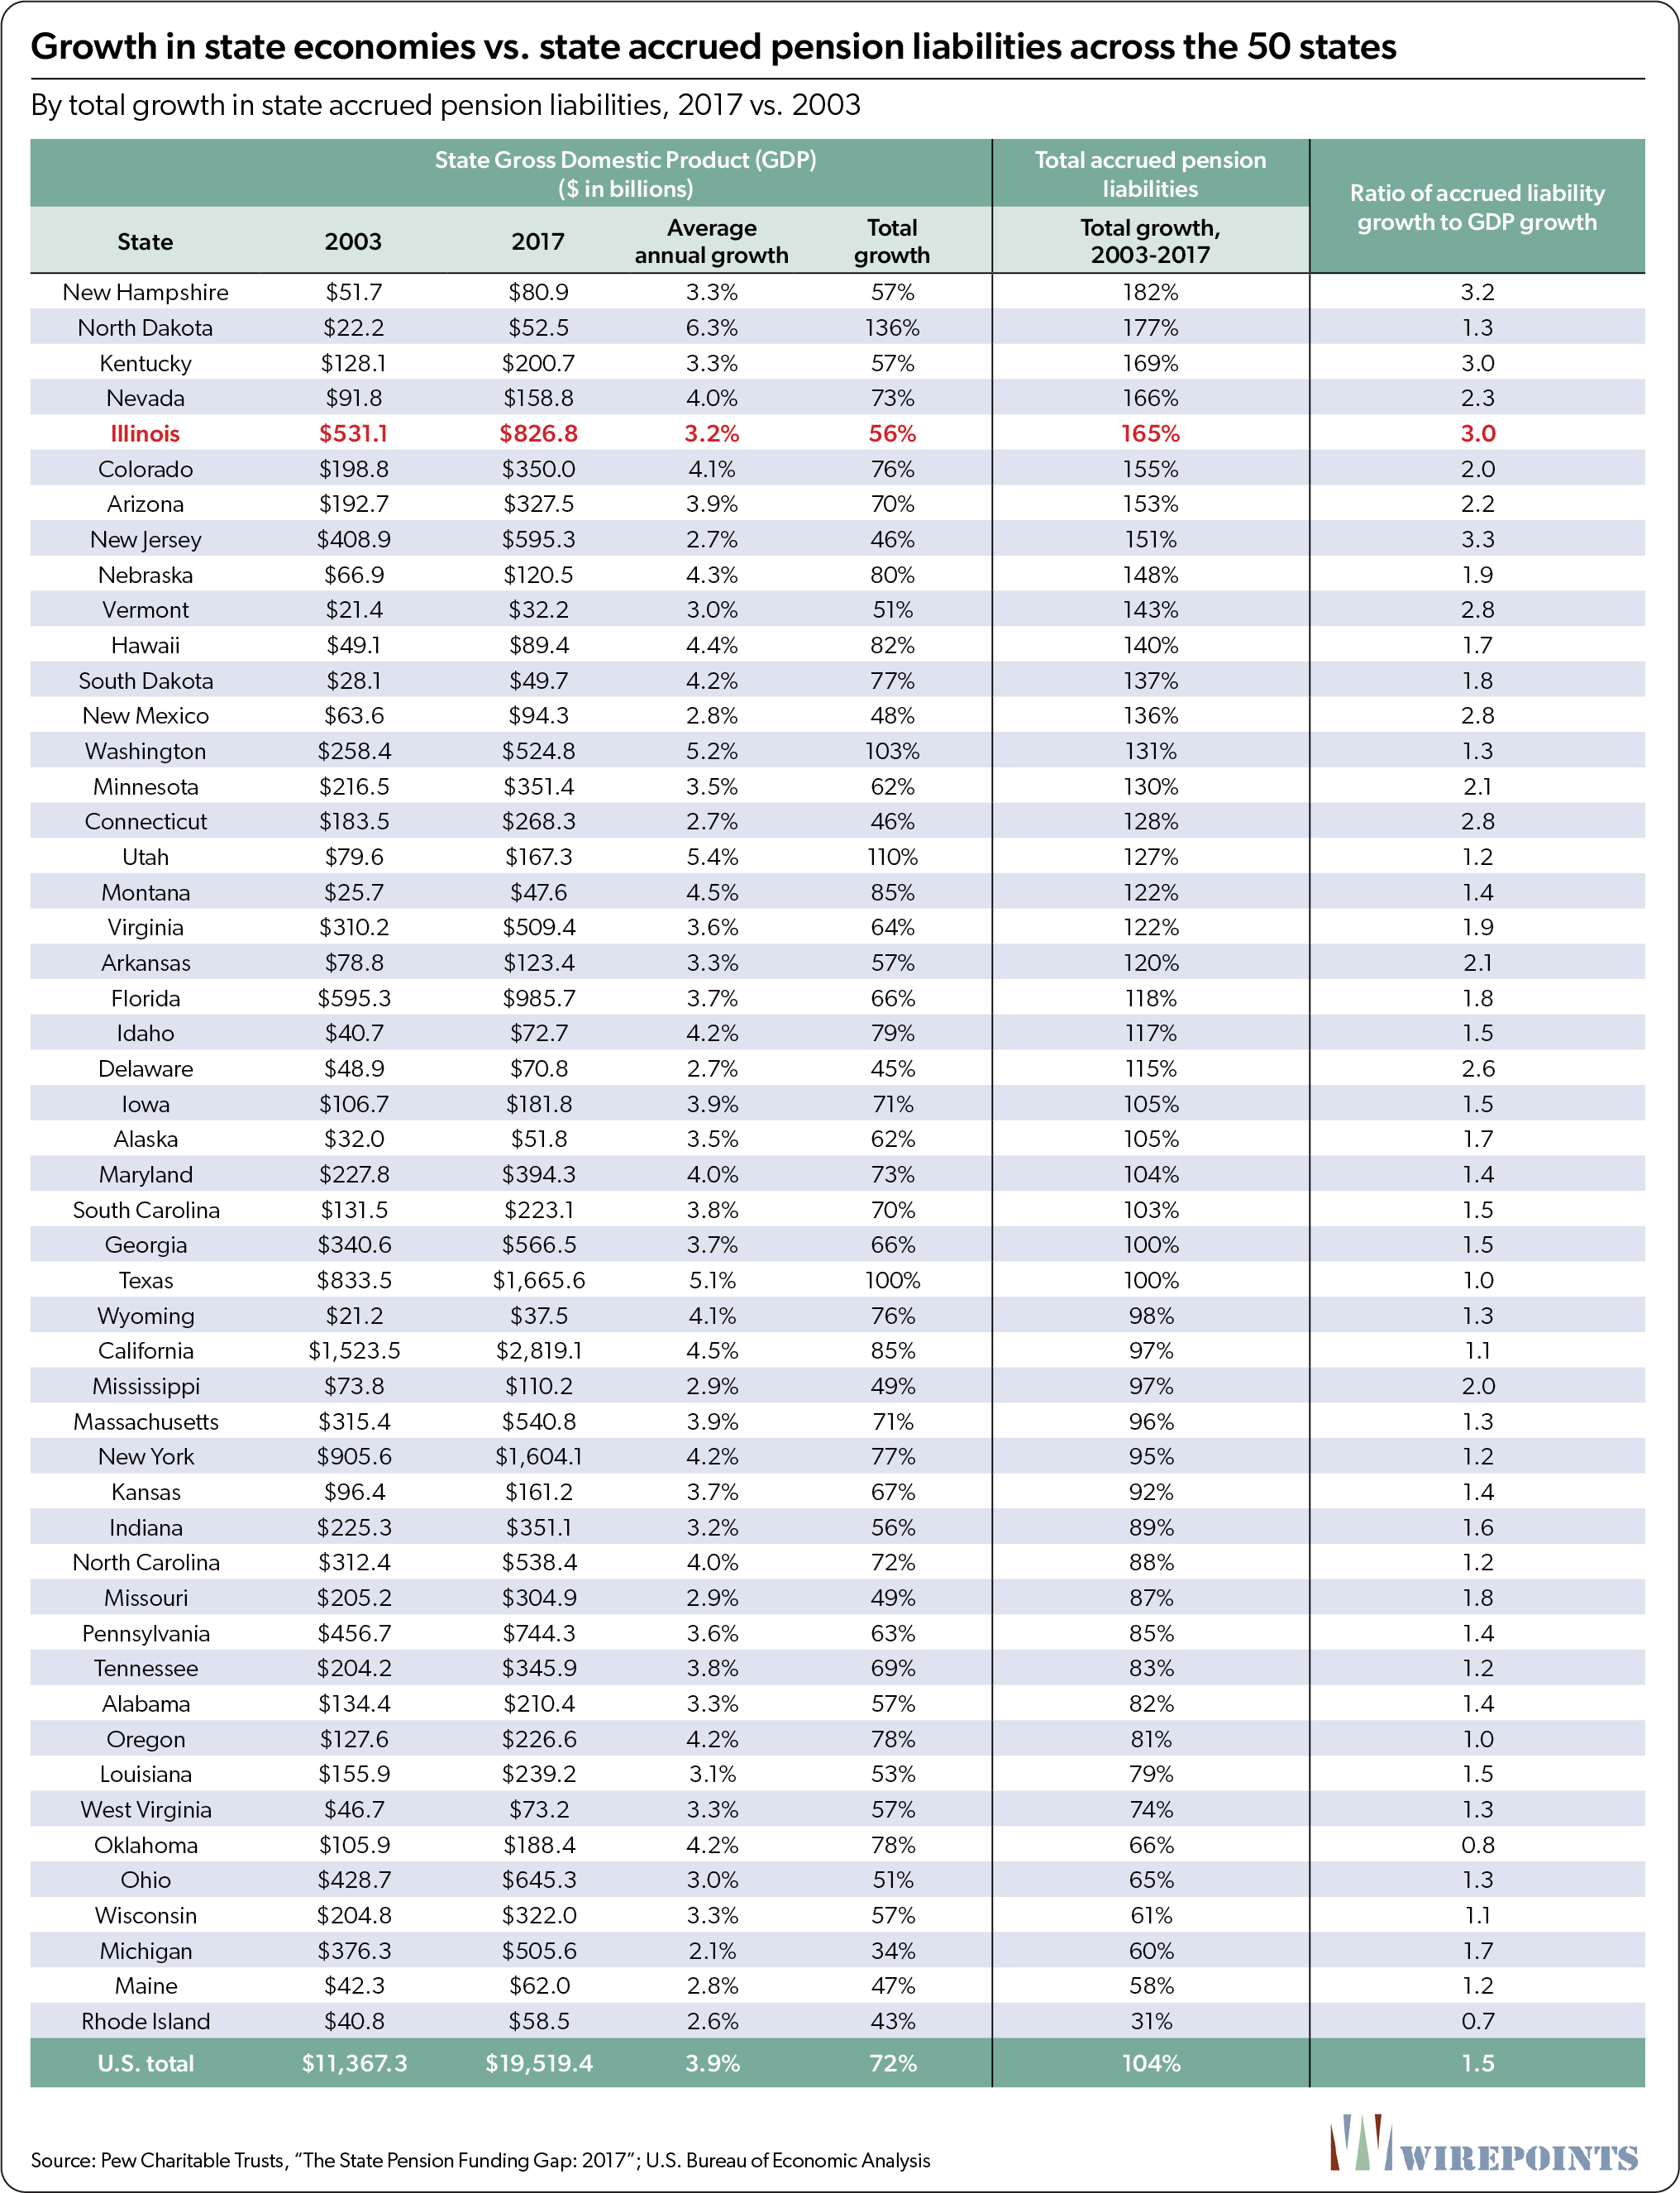
In 24 states, accrued liabilities outgrew their economies by 1.5 times or more between 2003 and 2017. And in 13 states, liabilities grew two times or more than their economies did. Illinois is one of them.
Illinois’ accrued liabilities grew 165 percent from 2003 to 2017, compared to a GDP growth of just 56 percent. That’s three times more over the entire period. Only New Jersey, New Hampshire and Kentucky’s accrued liabilities grew faster relative to their GDPs.
In contrast, states with low pension growth rates have largely prevented promises from overwhelming their economies.
Take Wisconsin, for example. The state’s pension promises grew a total of 61 percent between 2003 and 2017, barely more than the state’s GDP, which grew 57 percent. Rhode Island managed to keep its accrued liabilities from outgrowing its economy. Liabilities grew just 31 percent while the state’s economy grew 43 percent.
A common factor among the low growth states is their more reasonable benefit structures and a willingness to enact pension reform.
Wisconsin’s shared risk pension plan and relatively modest benefit structure have for decades kept the state’s promises limited and its pension system healthier than most other states.
Michigan pioneered comprehensive state pension reform in 1997 when it created 401(k)-style plans for new workers.
Rhode Island enacted major pension reforms in 2011. That’s one of the reasons why the state’s benefits have grown far more slowly than the economy. The state introduced hybrid retirement plans for existing workers, froze cost-of-living adjustments and increased retirement ages for both new and current workers.
Those states acted to get their retirement benefits under control. Unfortunately, Illinois can’t do the same because of its asymmetric pension protection clause.
Illinois pension assets have grown rapidly
Illinois’ pension crisis is currently wrapped up in a narrative of underfunding – that the state, and by extension its residents, never contributed enough to Illinois pensions. Those opposed to reform consistently blame underfunding as the cause of the state’s crisis.
But contrary to most assumptions, Illinois’ pension assets – buoyed by taxpayer contributions – have grown rapidly over the past three decades. Just like pension benefits, assets have grown far faster than any major measure of the state’s economy.
Unfortunately, Illinois’ extreme liability growth has simply overwhelmed one of the fastest pension asset growth rates in the country.
Illinois’ pension assets grew 5.5 percent a year between 2003 and 2017, the 8th-fastest nationally, based on an analysis of Pew data. The 50-state average was a much lower 3.4 percent. (See Appendix A for more details.)
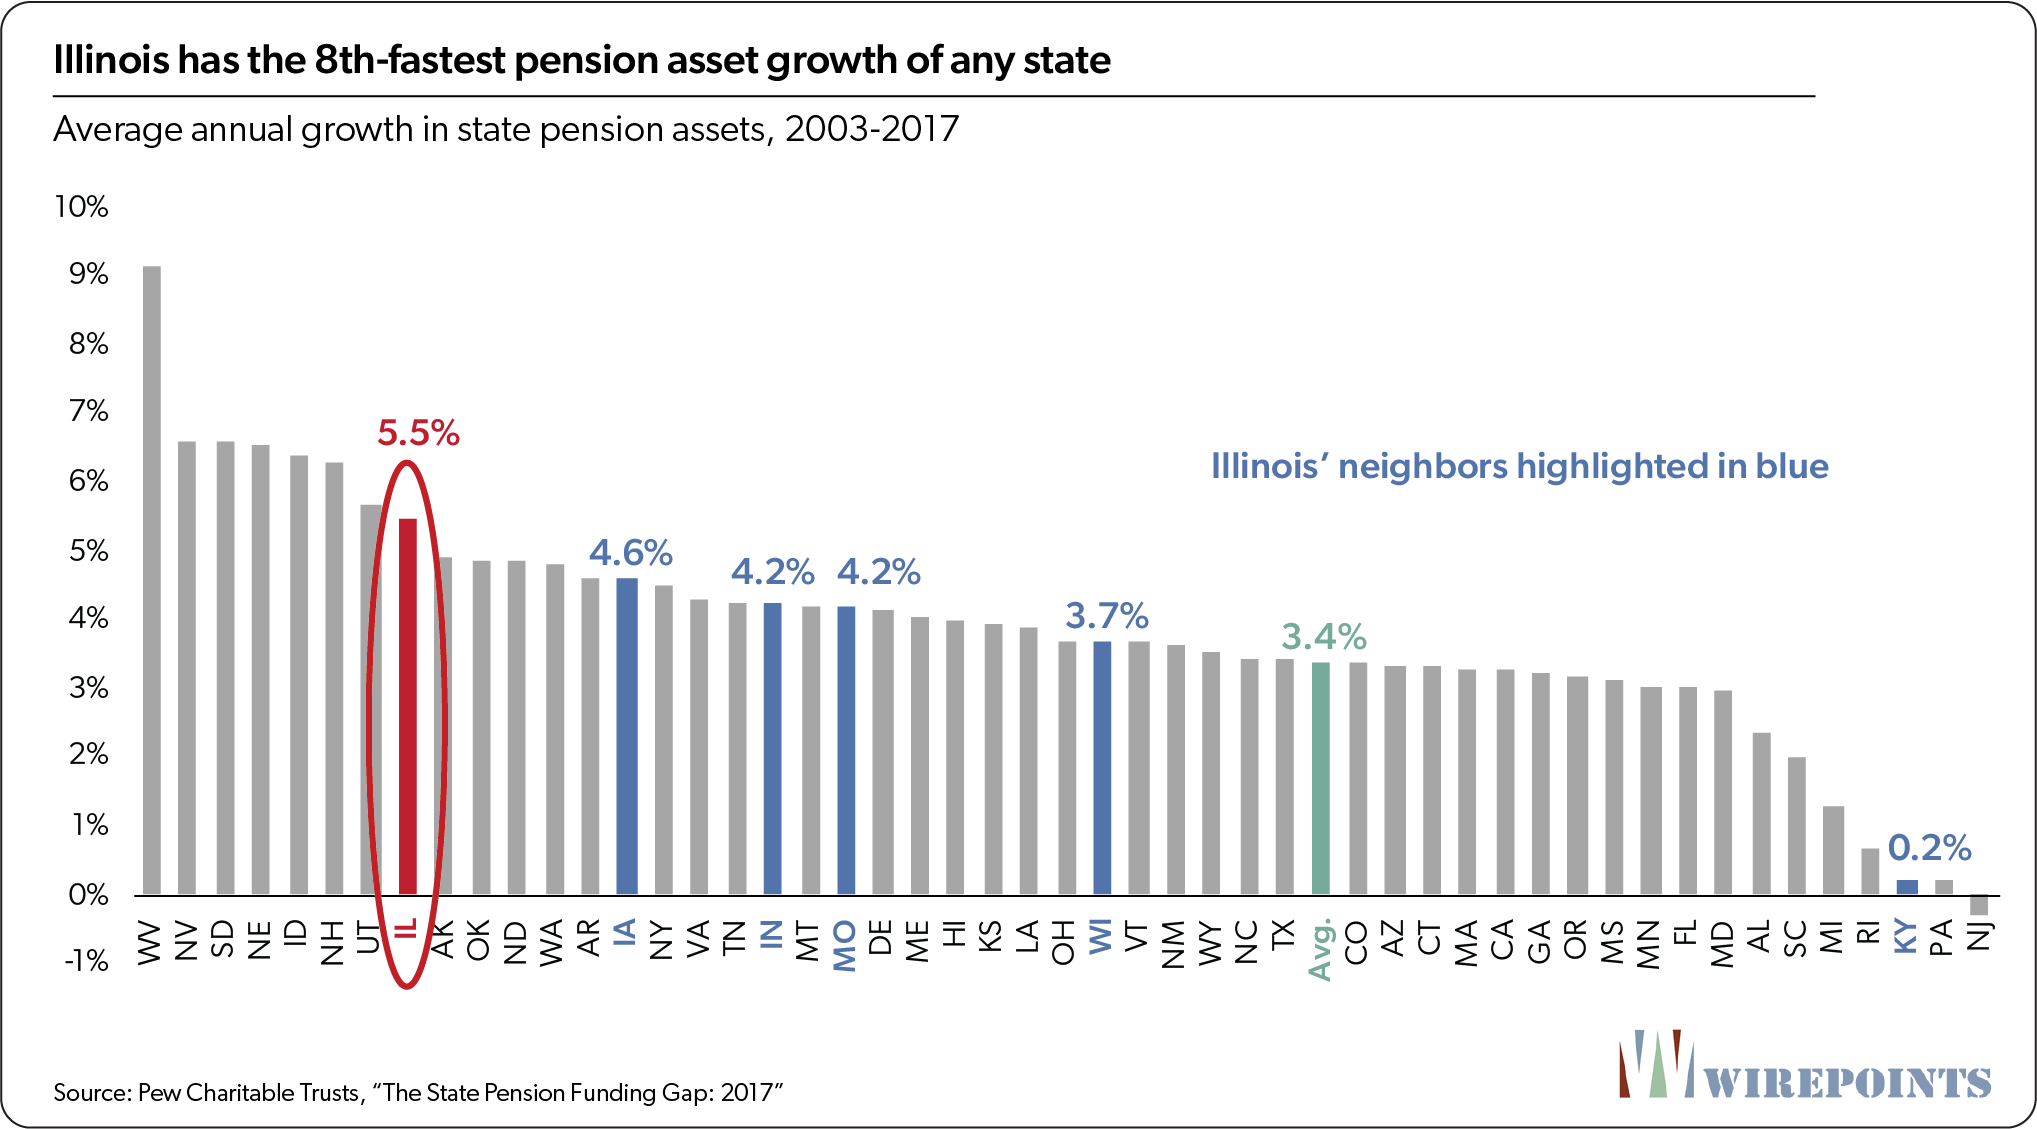
Illinois’ rapid asset growth also outpaced that of its neighbors. Iowa’s assets grew 4.6 percent annually, while Wisconsin’s grew 3.7 percent.
Illinois’ high asset growth rate differentiates it from the other states suffering a major pension crisis. Both Kentucky and New Jersey saw their assets stagnate or fall even as their liabilities skyrocketed between 2003 and 2017. Kentucky’s assets grew a paltry 0.2 percent annually at the same time that its liabilities grew 7.3 percent. And New Jersey’s assets actually shrunk compared to liabilities that grew 6.8 percent annually.
The takeaway is that Illinois’ fast-growing assets simply couldn’t keep up with the state’s growing promises.
Illinois’ pension assets grew faster than its economy
Illinois’ pension asset growth was even faster when measured over a longer period of time. The assets of the five state funds grew an average of 7 percent annually over the past 31 years, increasing from just $11 billion in 1987 to $90 billion in 2018.
Illinois’ assets have grown far faster than any major measure of the state’s economy. Assets are up 720 percent over the entire period while state general revenues grew just 275 percent.
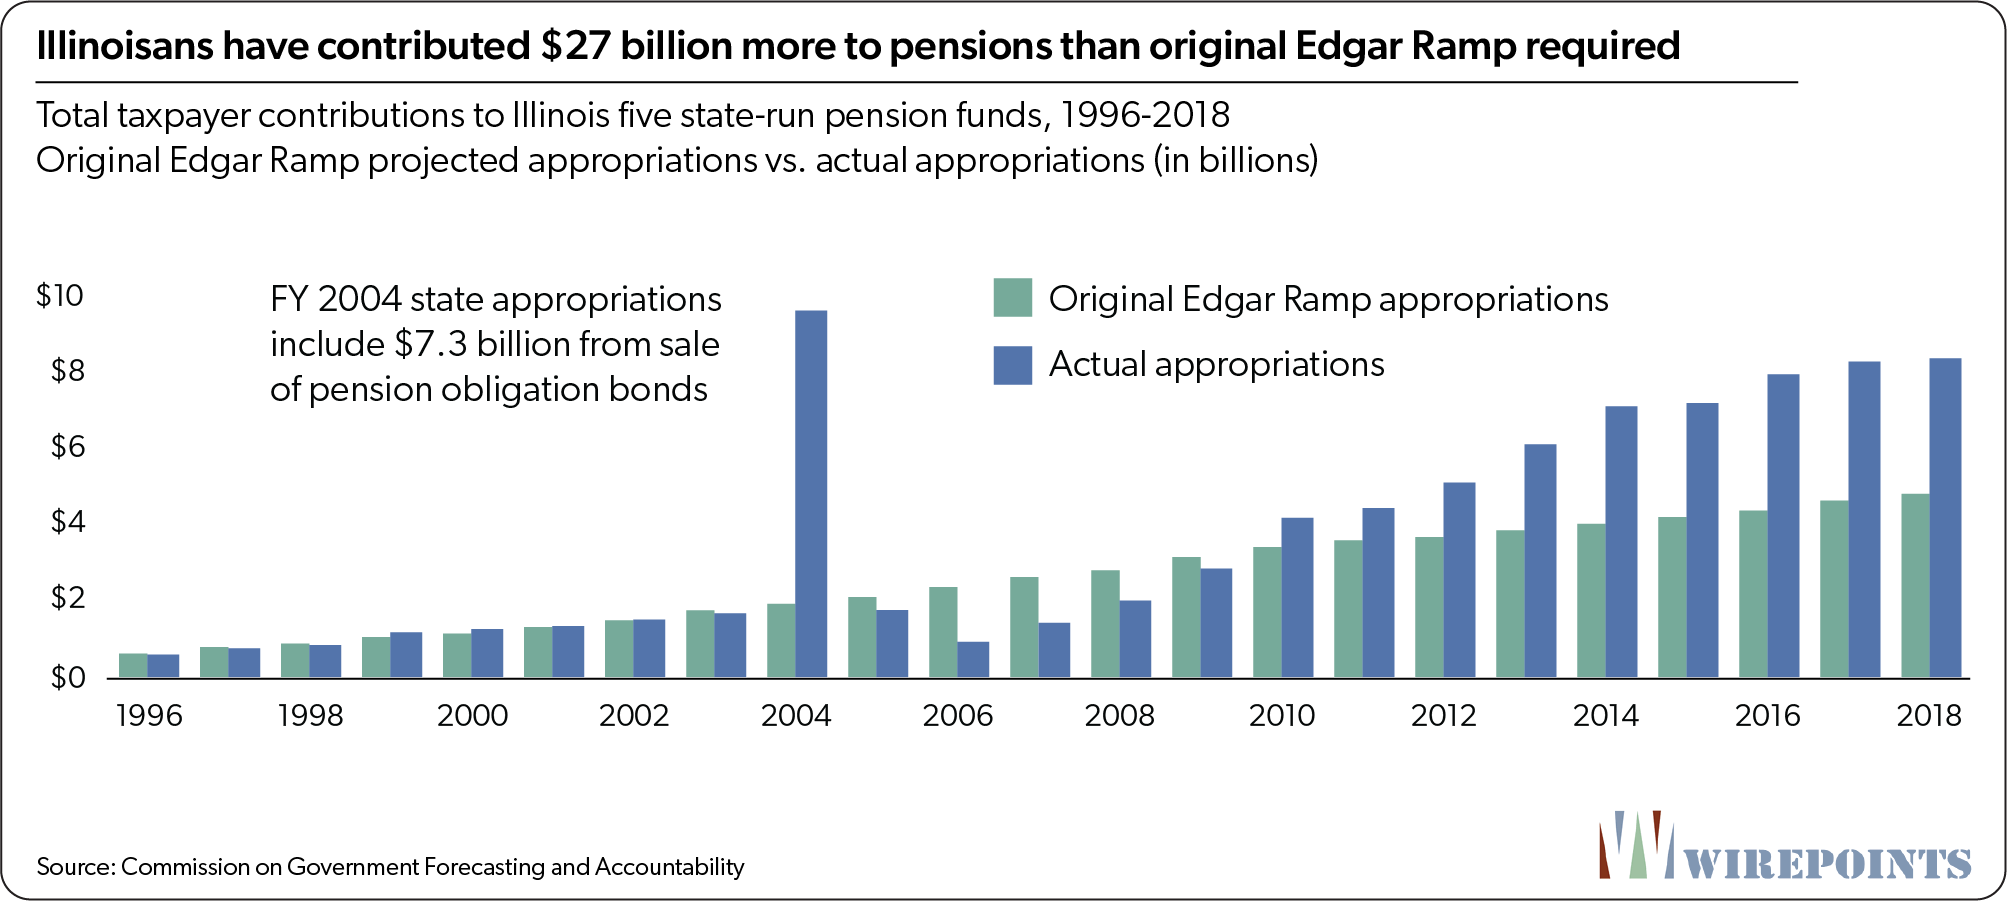
Much of the growth has come from taxpayer contributions into the pension plans. Most notable is the amount of funding put in by taxpayers since the implementation of the 1996 Edgar Ramp, the pension funding plan introduced by Gov. Jim Edgar.
The original ramp called for taxpayers to pay $56 billion into the pension systems from 1996 through 2018.
But taxpayers have ended up contributing far more than that. Taxpayers put $83 billion into the pension funds, or $27 billion more than the original ramp called for. In 2018 alone, taxpayers contributed over $3.5 billion more than the original ramp required.
However, that growth in assets has come at a cost. Illinois’ contributions to the pension funds have become so large that they now consume more than a quarter of the state’s annual budget. That’s left less funding available for other vital programs and social services.
Illinois would not be in crisis if its promises had grown at a reasonable rate
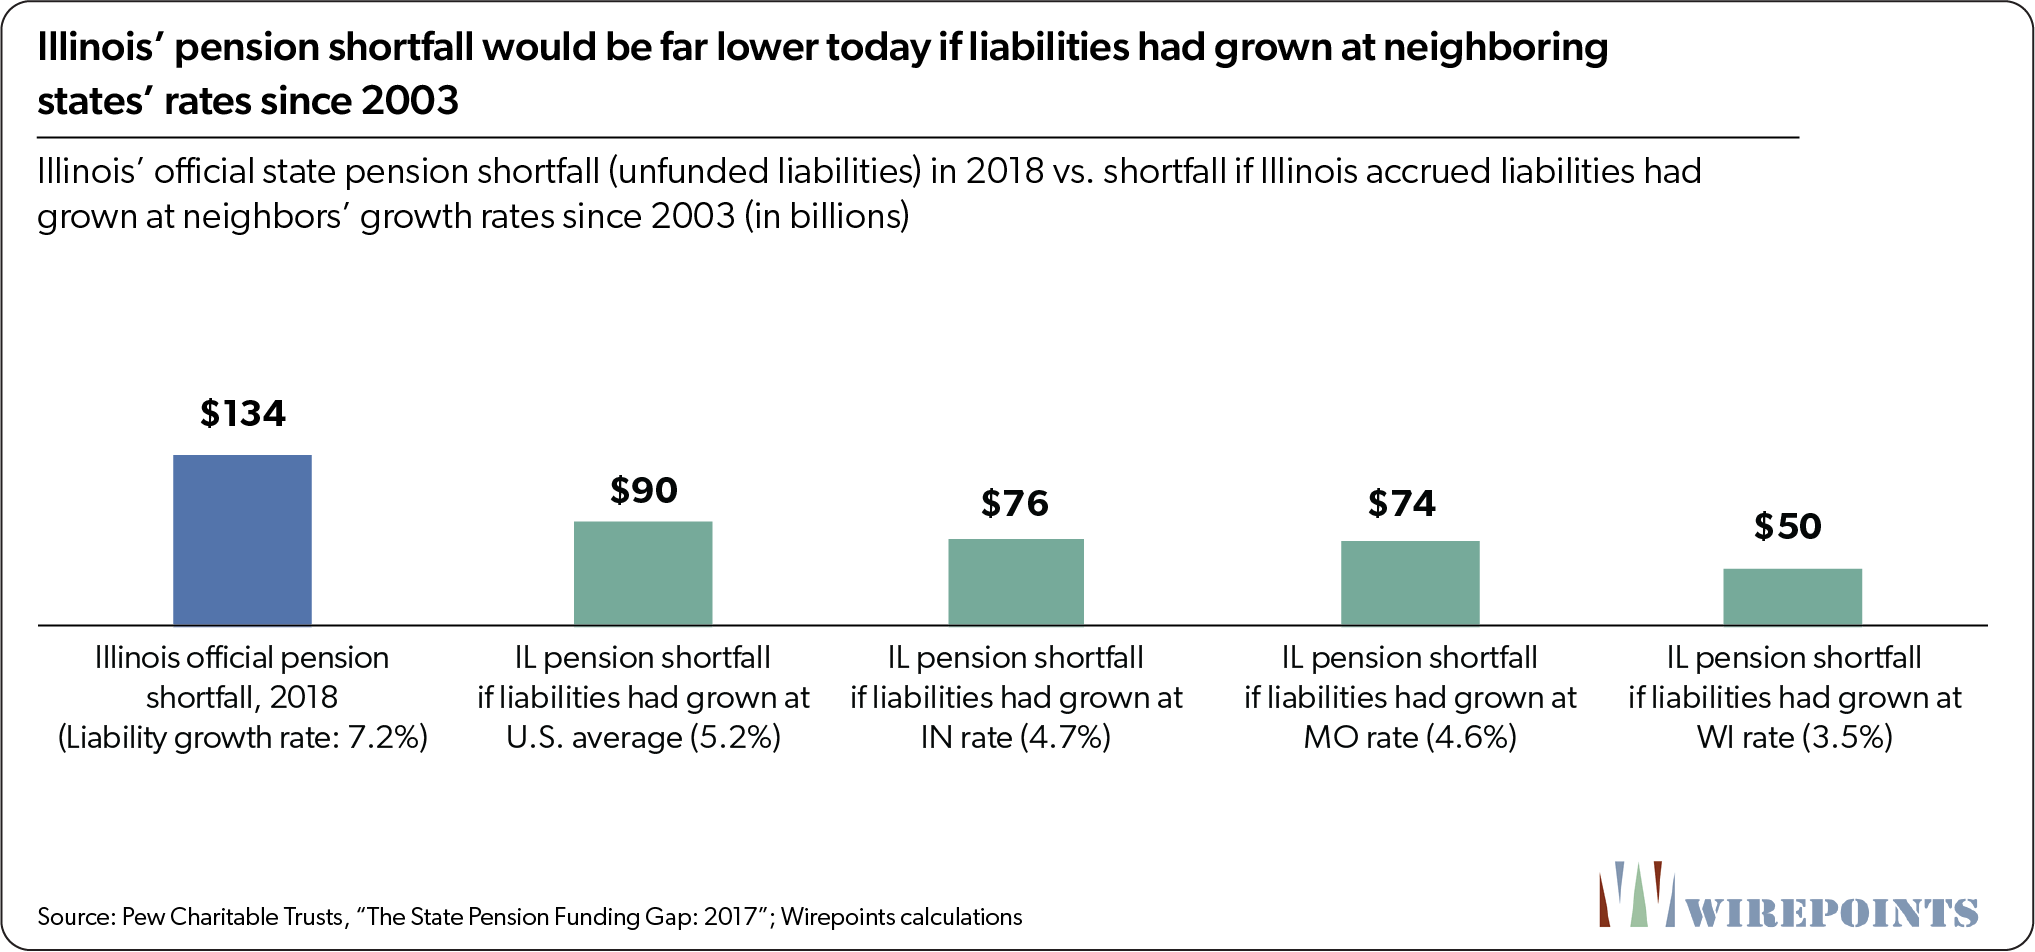
Illinois’ official $134 billion pension shortfall for 2018 would look dramatically different today if politicians had reformed pensions and slowed the growth of benefits back in 2003.
For example, if lawmakers had taken action to limit accrued liability growth to neighboring Indiana’s 2003-2017 rate of 4.7 percent, Illinois’ pension shortfall would have totaled just $76 billion in 2018. Or, if politicians had reformed pensions to match Wisconsin’s growth rate of 3.5 percent, Illinois’ shortfall would have been just $50 billion.
And if politicians had taken steps to slow the growth in pension liabilities three decades ago, Illinois could have avoided its current crisis.
Had Illinois’ accrued liabilities grown 5.3 percent annually since 1987, close to the 2003-2017 average growth rate nationally, instead of at 8.5 percent, the state’s assets would have caught up to its promises and Illinois would have been 100 percent funded in 2018 – at least under the state’s official actuarial assumptions.
A 5.3 percent growth rate in promises would still have been rapid when compared to Illinois’ economy and taxpayers’ ability to pay. But it shows that a more moderate growth in benefits over the past 30 years would have spared Illinoisans the burden of the nation’s worst pension crisis.

Illinois’ pensions are overly generous
Illinois’ long-term growth in pension promises stems largely from the generous benefits state workers receive. The state’s rules on retirement ages, cost-of-living adjustments (COLAs) and employee contributions – combined with automatic spiking, pension pickups, automatic sick leave and other perks – have resulted in annual pension benefits worth millions in retirement for career workers.
Critics of the current system often focus on double dippers and those with outrageous yearly pensions as the reason why Illinois pensions are unsustainable. Beneficiaries like that do contribute to the crisis, but that’s not where the bulk of the problem lies. Illinois’ pension crisis stems from the simple fact that the benefits provided to the average retiree are too expensive.
The best way to compare how overly generous Illinois retirements are is to look at the benefits of recently retired career workers with 30 or more years of service. That captures the full value of benefits and allows for an apples-to-apples comparison across states.
The average, recently retired, career state pensioner in Illinois receives $70,600 in annual pension benefits and can expect to collect over $2.3 million in total benefits. That’s a result of one of the most generous COLAs in the country, which doubles a retiree’s annual pension after 25 years in retirement.
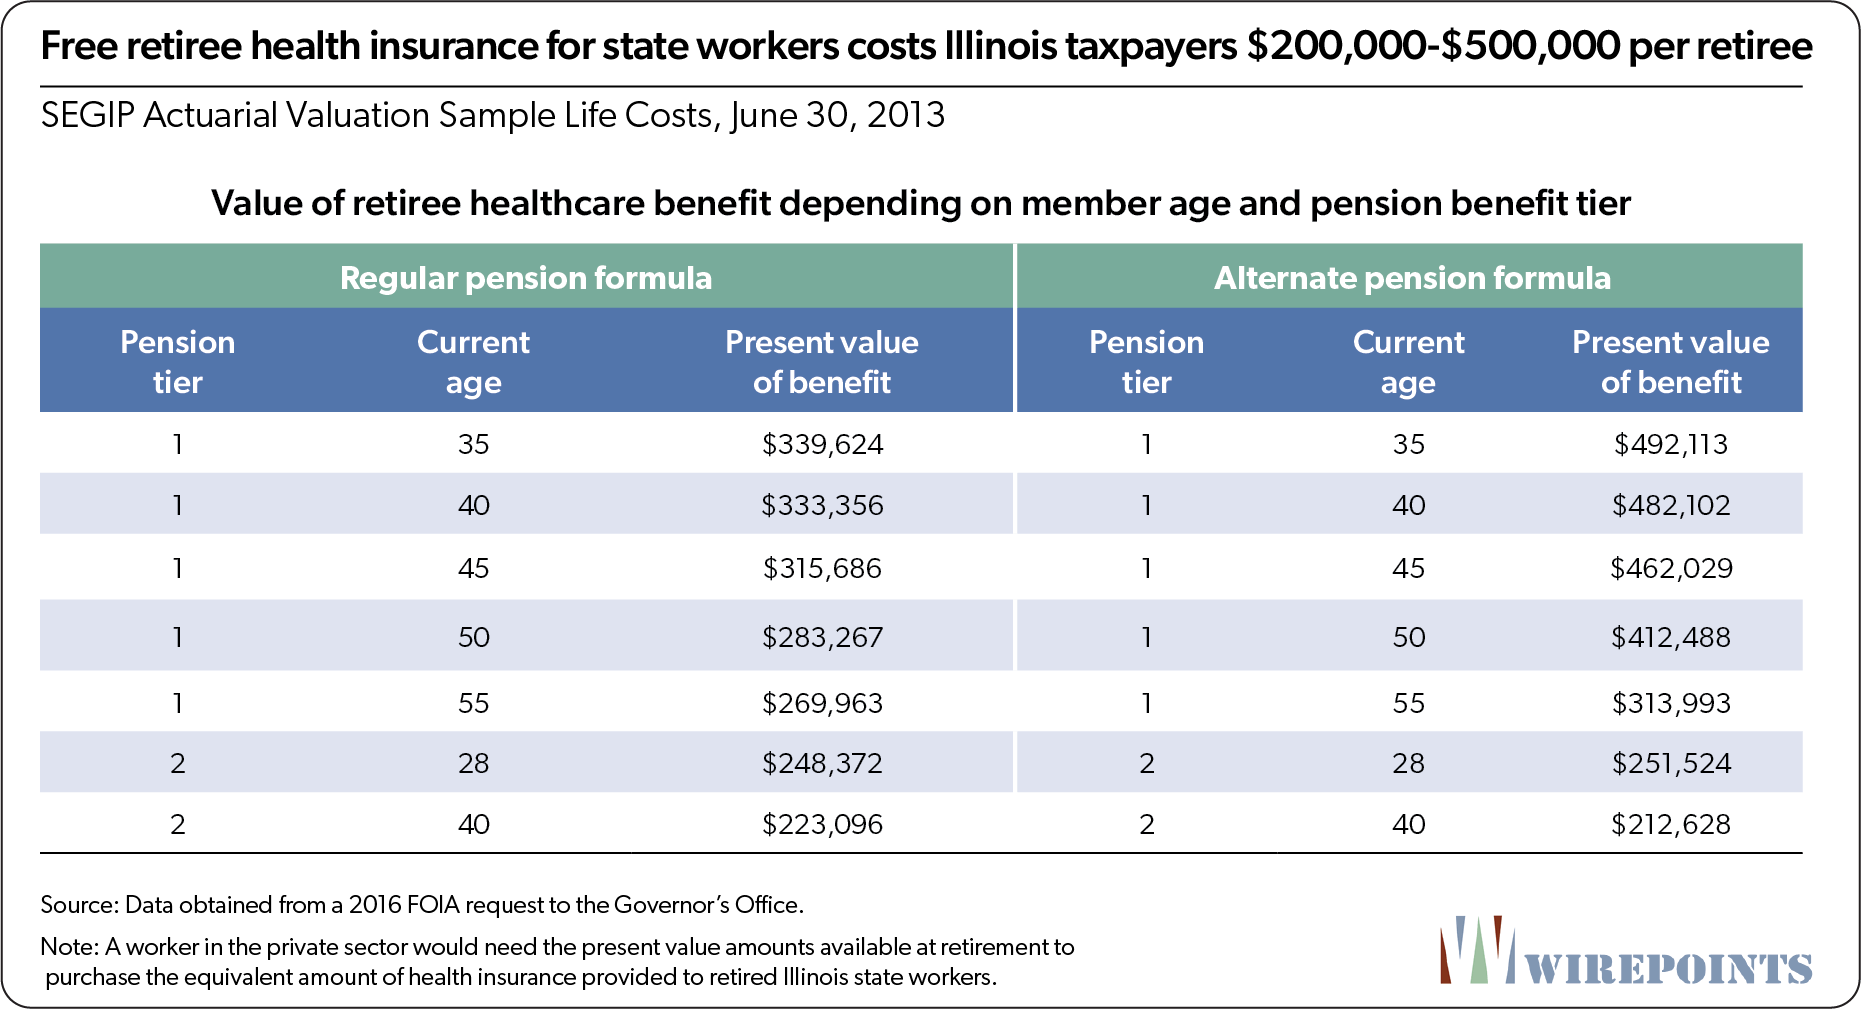
Pensions aren’t the only generous benefit career workers receive. Nearly 75 percent of Illinois state employees also receive free retiree health insurance. Those benefits are worth, in present value terms, $200,000 – $500,000 per retiree, depending on their tier.
In the following pages, Wirepoints compares Illinois’ teacher pension benefits and state worker retiree health insurance benefits to those of its peer states. Due to the high costs of hiring actuaries, Wirepoints limited its analysis to teacher pensions and state worker retiree health benefits.

A brief history of teacher pension benefit increases
Given the one-sided nature of the pension protection clause, past Illinois lawmakers should have been extremely careful about giving away any new benefits. But a review of teacher benefits – the Illinois Teachers’ Retirement System publishes a complete list of changes to the pension plan since 1915 – shows they weren’t. (See Appendix B for a summary of TRS benefit changes.)
Notable changes to teacher pensions benefits:
Cost-of-living increases
- 1969: COLA increased to 1.5 percent simple.
- 1971: COLA increased to 2 percent simple.
- 1978: COLA increased to 3 percent simple.
- 1990: 3 percent COLA increase compounded annually.
Pension benefit formula
- 1947: Pension formula: 1.5 percent of Final Average Salary (FAS) per year of creditable service with a 60 percent maximum. Final Average Salary calculated based on the last 10 years of service.
- 1971: Pension formula upgraded to 1.67 percent for first 10 years of service; 1.9 percent for next 10; 2.1 percent for next 10; and 2.3 percent for years over 30. Maximum percentage of FAS increased to 75 percent. FAS calculation changed to highest four consecutive years within the last 10 years of service.
- 1998: Pension formula upgraded to 2.2 percent a year. TRS member contributions increased by 1 percent.
Sick leave benefits
- 1972: Service credit granted for up to one-half year of unpaid sick leave.
- 1984: Service credit granted for up to one year of unpaid sick leave.
- 1998: Any unused sick leave could be used for credit, if not compensated in any other way.
- 2003: Service credit granted for up to two years of unpaid sick leave.
Retirement ages
- 1947: Retirement permitted at age 55 with 20 years of service; age 60 with 15 or more years of service.
- 1969: Retirement permitted at age 55 with 20 years of service; age 60 with 10 or more years of service; age 62 with 5 years or more of service.
Illinois teachers are the most generously compensated among neighbors, largest states
Wirepoints compared Illinois teacher pensions to 10 other peer states and found Illinois teachers receive the most generous pension benefits by far. High Final Average Salaries, early retirement ages, and one of the nation’s most generous COLAs allow Illinois teachers to out-earn their colleagues in expensive states like California and New York, even before adjusting for cost of living.
Wirepoints focused on teacher benefits since they’re a proxy for the generosity of Illinois’ overall pension system. Teachers’ Retirement System benefits make up nearly 60 percent of the state’s obligations and teachers are the nation’s single largest homogenous group of government workers.
Important factors considered (See Appendix C for additional details.)
- Wirepoints focused on the benefits of career teachers with 30-plus years of service who retired in FY 2018, allowing for an apples-to-apples comparison across states. Wirepoints acknowledges there are many new tiers offering different levels of benefits across the states, including in Illinois, but the overwhelming majority of earned benefits are still owed to teachers in older tiers.
- Illinois’ peer states were limited to the following: Illinois’ five neighboring states, which directly compete for talent and investment, and the nation’s five largest states by population.
- Teachers in the majority of Illinois’ peer states participate in Social Security. Those benefits are included in our analysis of teachers’ total retirement benefits.
- Wirepoints used the U.S. Bureau of Economic Analysis’ Regional Price Parities Index to adjust for cost-of-living differences across states.
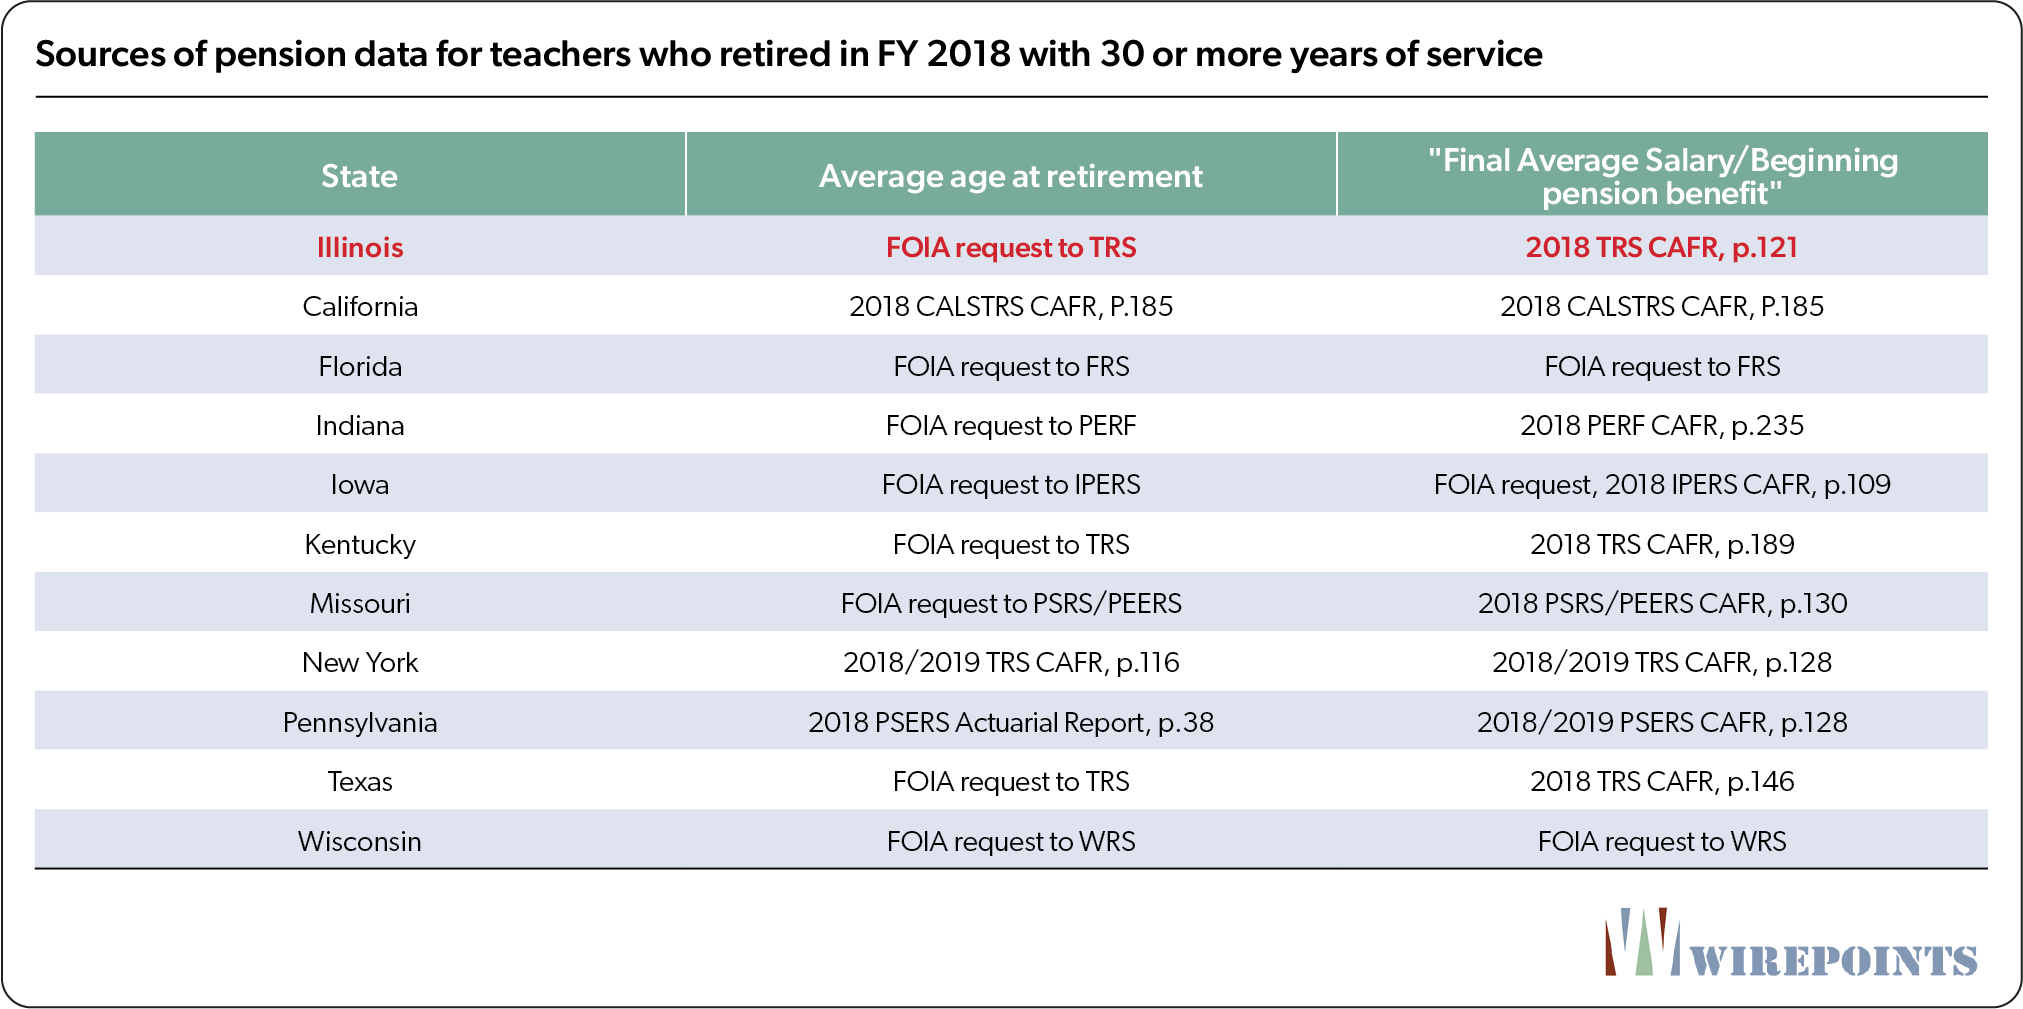
- Teacher benefit data was obtained from 2018 Comprehensive Annual Financial Reports or from individual state FOIA requests.
Summary findings
The average career teacher in Illinois, after adjusting for regional price differences, will receive approximately $2.9 million in pension benefits over the course of her retirement. That same teacher in New York will receive approximately $2.1 million, while a California teacher will receive $2.0 million.
Teachers in Illinois’ neighboring states will, on average, receive far less than that. Benefits range from $2.4 million for Kentucky teachers to $1.6 million for Indiana teachers. Teachers in Texas will receive about $1.36 million, the lowest of Illinois’ peer states.
Those total benefits include expected Social Security payments. Teachers in New York, Florida, Pennsylvania, Wisconsin, Iowa and Indiana participate in Social Security. Teachers in Illinois, California, Kentucky, Missouri and Texas do not. (Individual districts in Texas and Missouri have the option to enroll teachers in Social Security, but a majority of districts in each state do not do so.)


Breaking down the elements of teacher pensions
Pension comparisons are complicated given the host of factors that help determine total benefits. Those include salaries, pension formulas, ages at retirement, cost of living adjustments and other perks including end-of-career spiking and accrual of unused sick leave days.
Fortunately, most of those elements are captured in four numbers: Final Average Salary, beginning pension benefit, age at retirement, and post-retirement cost-of-living adjustments. Wirepoints compares those factors across the surveyed states for career teachers with 30-plus years of service who retired in FY 2018.
1. Final Average Salaries
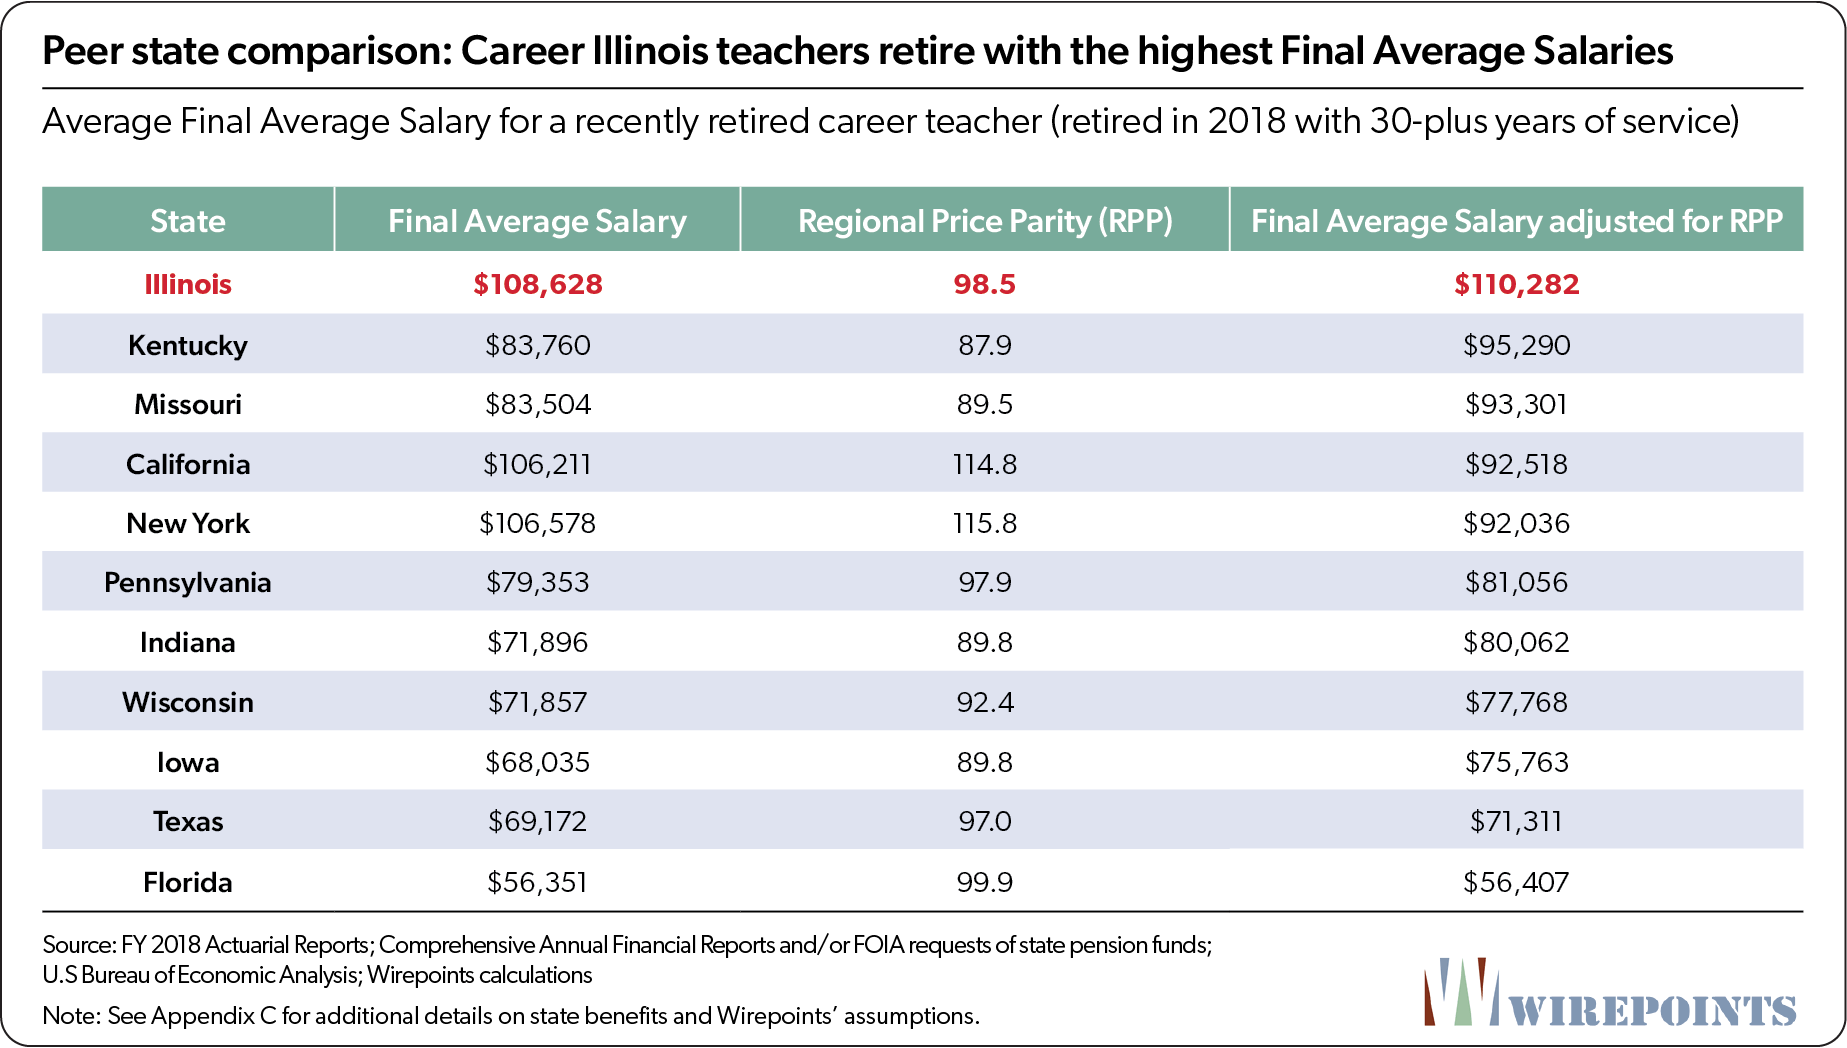
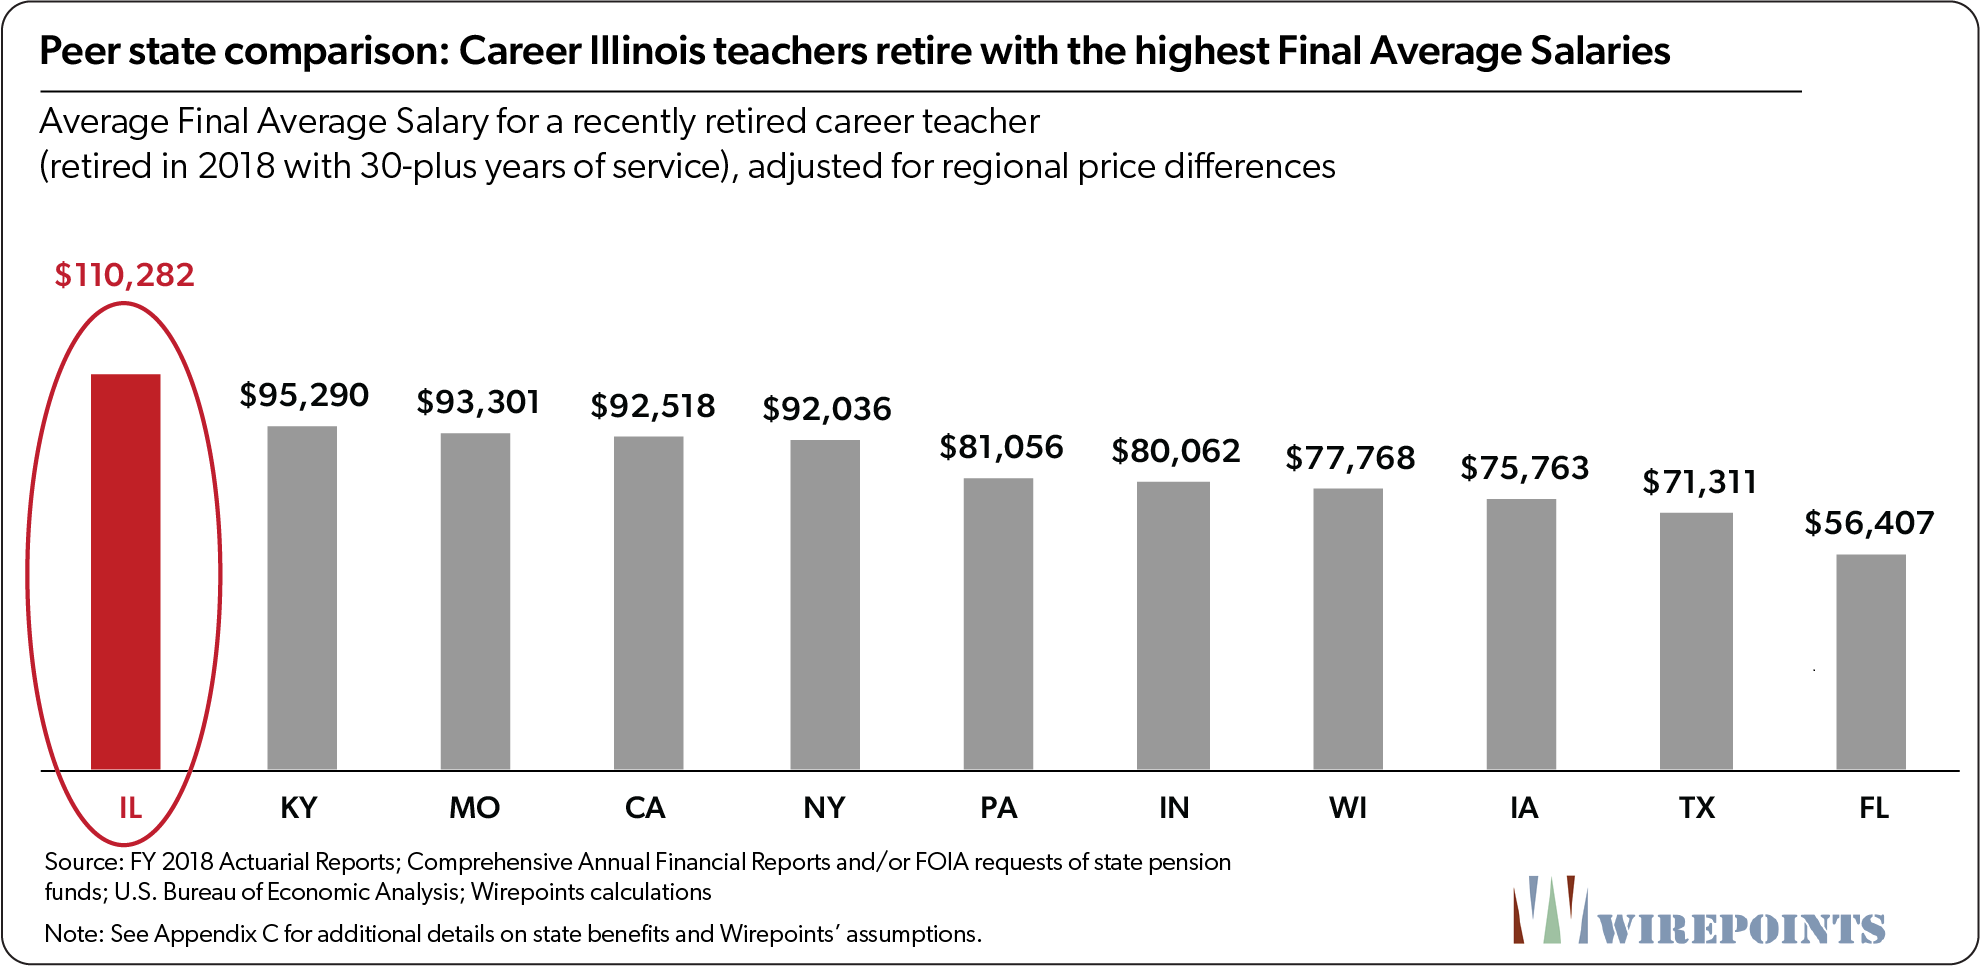
Career Illinois teachers retire with a final average annual salary of $108,628, the highest amount among the states Wirepoints surveyed. New York and California teachers are close behind with salaries of about $106,000. No other state salary breaks $100,000.
After adjusting for regional price differences, the gap in salaries between Illinois and its peer states grows significantly. Illinois teachers alone receive more than $110,000 in salaries, while New York and California’s drop to the $92,000 range.
Teachers in several states, including Pennsylvania and Florida, have Final Average Salaries after adjustment that are $30,000-$50,000 lower than Illinois’.
Those salaries matter because they serve as the base for the calculation of teacher pension benefits. The rules for determining the Final Average Salary across states are relatively uniform, with most states calculating it as the average of the three highest years (36 months) of salary. Illinois’ Tier 1 pension rules base a teacher’s Final Average Salary on her four highest consecutive years of service.
California has the most generous rules; there, teachers’ Final Average Salary is based on the average of the 12-highest months of service. At the other end, Indiana averages the last five years of a teacher’s service. The rules for the remaining states fall somewhere in between.
2. Beginning pension benefit
The beginning pension benefit of a retiring career Illinois teacher was $80,839 after adjusting for cost-of-living. Again, that is the highest among Illinois’ peer states.
Career teachers in New York receive the next highest starting benefits of $78,687 – including both a pension and a Social Security benefit. Teachers in Missouri, California and Pennsylvania receive approximately $74,000.
Below that, teachers from Kentucky to Florida receive beginning annual benefits ranging anywhere from $73,884 to just $43,161.


3. Retirement age
The age at which teachers begin to collect their pensions partially determines the total lifetime benefits they’ll receive. Retirement age rules vary widely among states, but in general, most allow teachers to begin collecting benefits in their 50s after about 30 years of service.
The average career Illinois teacher began collecting a pension at age 59, while career Missouri teachers had the lowest average retirement age at 57.3. California teachers, meanwhile, begin drawing pensions at the average age of 62.6, almost four years after career Illinois teachers do.

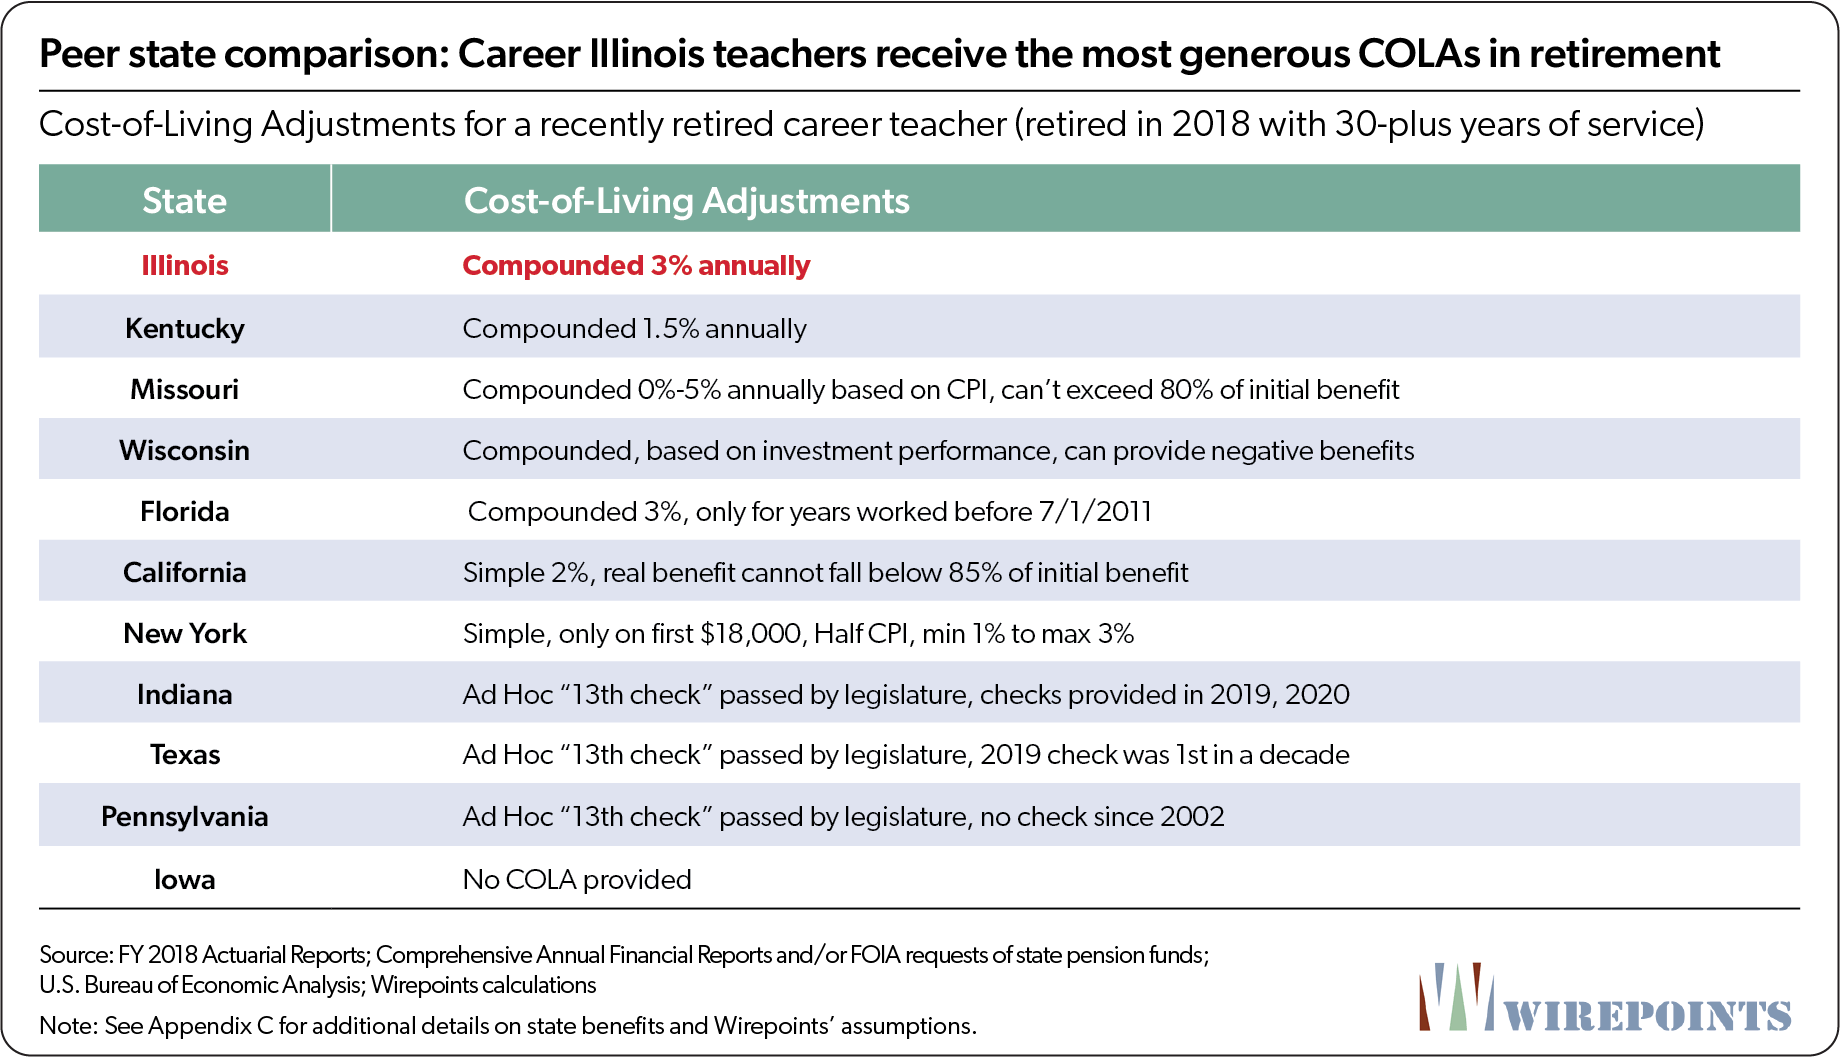
4. Cost-of-living adjustments
Cost-of-living adjustments have one of the biggest impacts on a teacher’s overall benefits because they determine how much annual benefits grow in retirement, if at all.
Illinois grants all teachers, beginning at age 61, an automatic, 3-percent compounded COLA, which is the most generous of any of the 11 states surveyed.
Texas, Pennsylvania, and Indiana grant COLAs on an ad-hoc basis, meaning the legislature decides each year whether to grant an increase, also called a “13th check.” That rarely happens in some states. Last year, Texas gave its first increase in more than a decade and Pennsylvania hasn’t granted an increase since 2002. Indiana granted small 13th checks to retirees in 2019 and 2020.
Florida stopped offering an automatic COLA in 2011. And Wisconsin’s COLA benefit varies widely from year to year based on the fund’s investment returns, sometimes even creating negative annual benefits.
Even New York and California don’t offer COLA benefits as generous as Illinois’. California grants a 2 percent simple COLA with a special provision protecting against inflation. And New York’s COLA benefits range from 1 to 3 percent a year, but only apply to the first $18,000 of a teacher’s pension, meaning the maximum annual benefit a teacher can receive is $540.
The impact COLAs can have on annual pension benefits is dramatic. For example, Illinois’ compounded, automatic 3 percent increase doubles a teacher’s annual pension benefit after 25 years. A teacher retiring with a starting pension of $100,000 in 2020 will receive more than $203,000 in 2045.
Kentucky’s 1.5 percent compounded COLA would grow a $100,000 starting pension to $142,950 in 25 years, a 43 percent increase. New York’s COLA benefit would boost a teacher’s $100,000 starting pension to $112,960, assuming the teacher receives the maximum 3 percent simple increase each year. Meanwhile, teachers in Iowa don’t receive a post-retirement pension boost at all.

The comparison to their peers shows Illinois teachers receive some of the nation’s most generous benefits. But a more appropriate comparison is to the retirements of the private sector workers who pay for public sector workers. That’s where real discrepancy exists.
Private sector Illinoisans retiring today would have to have approximately $1.8-$2 million at the time of their retirement to get the same $2.3 million lifetime payout career state workers receive. The vast majority of ordinary Illinoisans have nowhere near that amount saved.
The benefits provided by Social Security don’t approach the level of pensions, either. The average Social Security benefit for Illinoisans is just $17,000 a year, and the annual maximum is just $36,000. The combined benefits in the private sector from retirement accounts and Social Security don’t come close to matching the pension of a career public sector worker.
Career state workers in Illinois receive free retiree health insurance
Wirepoints compared state worker retiree health insurance benefits across Illinois’ 10 peer states and found Illinois workers enrolled in the State Employees Group Insurance Program (SEGIP) receive the most generous subsidies.
Illinois state workers with at least 20 years of service can retire in their mid-50s and receive full health insurance coverage at no charge, with state taxpayers picking up the entire cost of premiums.
SEGIP offers state workers a 5 percent discount on their retiree health insurance premiums for every year of work, starting at 50 percent (after 10 years of vesting) and maxing out at 100 percent for 20 years of service. Members who retired before 1998 earned free health insurance after just 8 years of service.
Most workers receive the full premium subsidy during retirement since a vast majority retire with more than 20 years of service. Wirepoints found that 73 percent of currently retired State Employee Retirement System members are eligible for free retiree health insurance.
The plan is especially rich because it covers the full cost of retiree health insurance premiums for workers who retire before they are Medicare-eligible (age 65). That means state taxpayers pick up the full insurance costs of those retirees until they turn age 65, when Medicare finally becomes the primary payer for those retirees. Since some workers can retire with full pension benefits and retiree health benefits as early as age 55, the increased costs to taxpayers become significant.
Medicare-eligible retirees with 20 years or more of service cost state taxpayers between $6,500 and $7,000 a year. Pre-Medicare age retirees currently cost the state $12,000 to $15,000 annually.
The present value of that benefit for career workers was worth $200,000 to $500,000 per retiree in 2013, depending on the pension tier and age, according to FOIA data obtained from Illinois’ Office of the Governor.
In all, the state pays for 90 percent and retirees pay for 10 percent of SEGIP’s annual retiree health insurance costs.
Illinois retiree health benefits vs. other states
Illinois is at the extreme end of state-provided retiree health insurance. Its benefits outclass most states and anything workers in the private sector receive. According to a 2011 study by Mercer Consulting on behalf of Illinois’ Commission on Government Forecasting and Accountability (COGFA), state, county and city governments across the nation offer retiree health insurance benefits that, on average, require employees to pay just over half of their premiums.
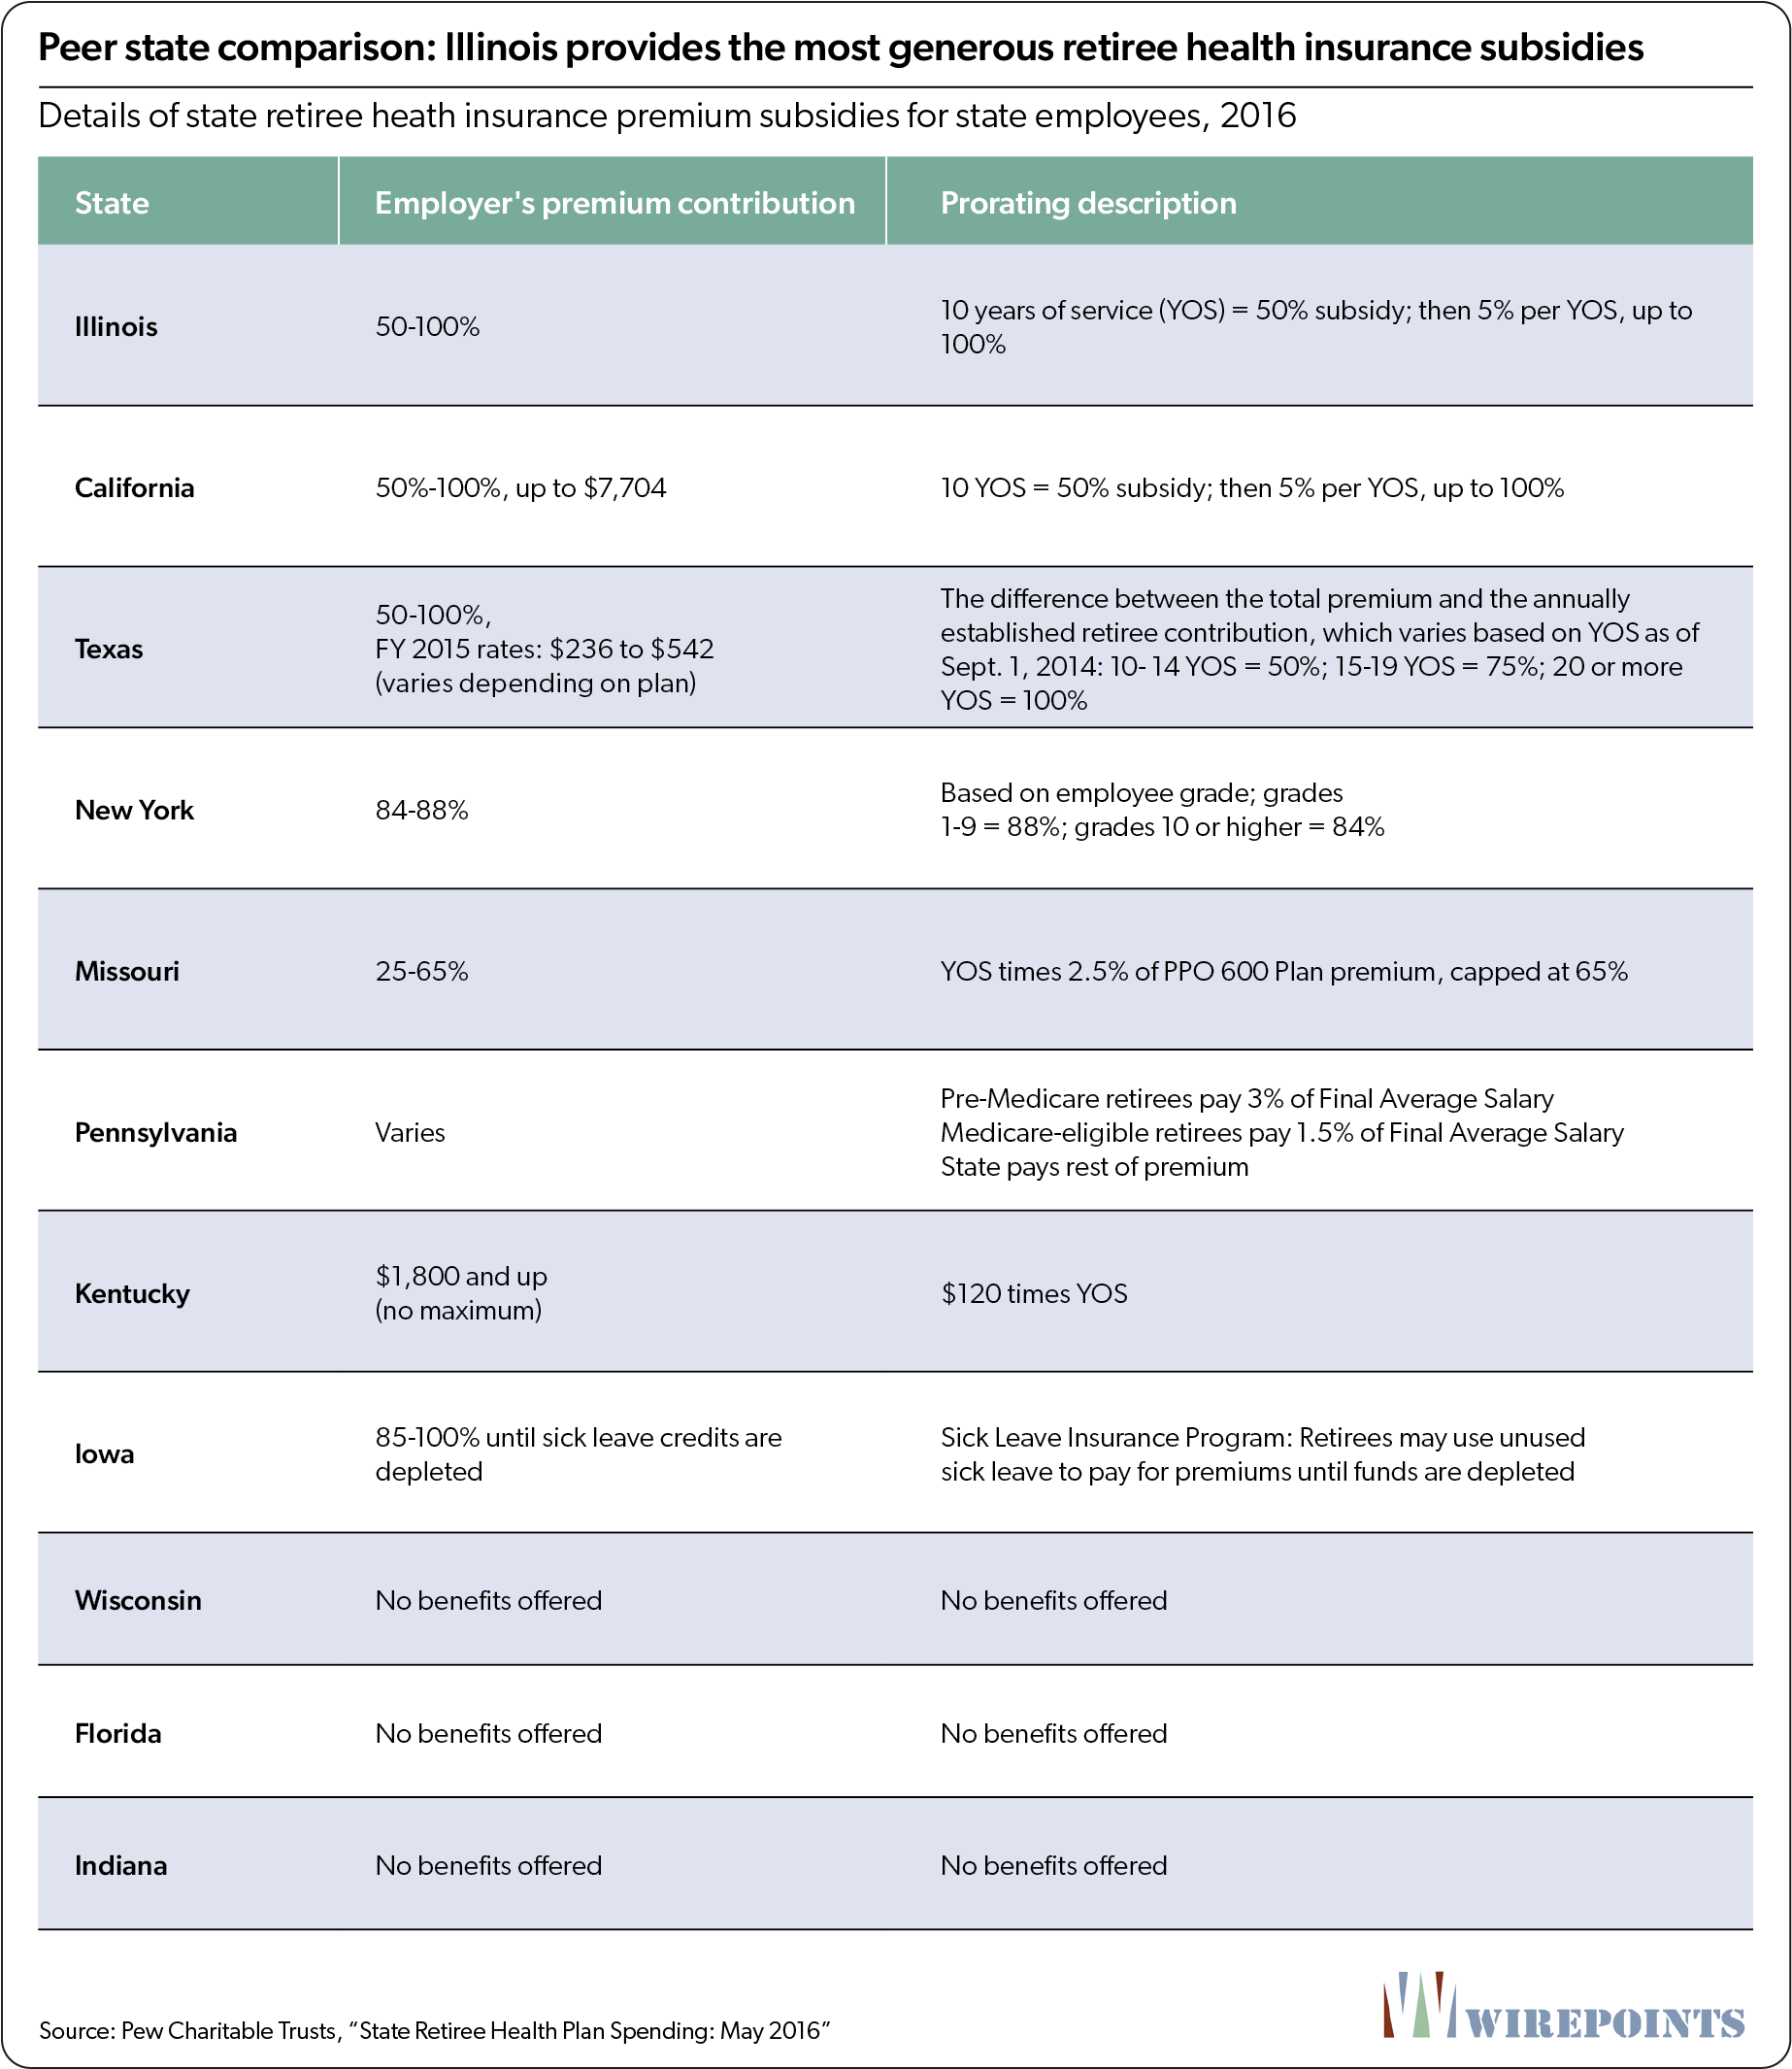
Among Illinois’ 10 peer states, four provide no subsidies for retiree health insurance and four provide a partial subsidy, according to 2016 data collected by Pew Charitable Trusts. Two states provide a maximum guaranteed subsidy of 100 percent of premiums like Illinois does, but cap the subsidy amount they provide.
Specifically, Indiana, Wisconsin, Florida and Iowa provide no retiree health insurance subsidies.
Missouri and New York provide a maximum subsidy of 65 percent and 88 percent of premiums, respectively. Pennsylvania subsidizes the remaining insurance costs after pre-Medicare retirees contribute 3 percent and post-Medicare retirees pay 1.5 percent of their final salary. Kentucky provides a subsidy of $120 for every year of a retiree’s service (the subsidy for 30 years of work totals $3,600 annually).

California has the same subsidy structure as Illinois: 5 percent for every year worked. And Texas provides up to a 100 percent subsidy for annually determined premium contributions based on years of service. But both limit their maximum provided subsidy to $7,704 and $6,504, respectively. In contrast, Illinois’ maximum subsidy in 2015 was the highest of all its peer states, at $13,500 annually.
Finally, when it comes to a private sector comparison, Illinois’ free, state retiree insurance benefits make it an outlier. Most small- and medium-sized employers, which account for 80 percent of all workers, don’t offer retiree health insurance at all. There’s simply no comparison. And of the few large private sector firms that do offer coverage, employees are, on average, responsible for paying half of their costs.
Conclusion
Illinois’ decades of overpromising and politicians’ refusal to acknowledge the state’s growing problems have created the worst pension crisis in the nation. There is simply no fixing Illinois without changing the current pension system and dramatically reducing the state’s retirement debts.
Unfortunately, Illinois politicians continue to deny the possibility of any kind of structural pension reform. They dismiss any meaningful changes as a legal impossibility.
But there is a path to reform. Illinoisans can amend the state constitution’s pension protection clause and then enact the statutory reforms Illinois needs.
The third part of Wirepoints’ four-part series will cover how a state constitutional amendment for pension reform would work in Illinois and why it would survive any state or federal constitutional challenges.
Appendices
Appendix A. Pension liabilities across the 50 states
Appendix B. A brief history of granted pension benefits
Given the one-sided nature of the pension protection clause, past Illinois lawmakers should have been extremely careful about giving away any new benefits. But a review of teacher benefits – the Illinois Teachers’ Retirement System publishes a complete list of changes to the pension plan since 1915 – shows they weren’t.
Politicians have granted teachers compounding COLAs, increased benefit formulas, early retirement options, sick leave accumulation and more since the 1950s. Some of those benefits have been given away for free. Other benefits, though “paid for” with increased teacher contributions, were still grossly underpriced.

Cost-of-living increases
Illinois’ current cost-of-living adjustments for Tier 1 workers are the single biggest contributor to the state’s pension distress. What started as a simple annuity increase at levels approximating inflation has now become a compounded yearly increase that doubles a retiree’s annual pension after 25 years.
- 1969: COLA increased to 1.5 percent simple
- 1971: COLA increased to 2 percent simple.
- 1978: COLA increased to 3 percent simple.
- 1990: 3 percent COLA increase compounded annually.
Pension benefit formula
Pension benefits for every year worked were originally calculated as 1.5 percent of each worker’s final average salary (FAS) with a maximum of 60 percent. By 1998, the formula had been changed to 2.2 percent of final salary with a maximum of 75 percent. Under the original rules, a teacher had to work 40 years to get the 60 percent maximum. Today, a Tier 1 teacher only needs to work 34 years to achieve the 75 percent maximum.
- 1947: Pension formula: 1.5 percent of FAS per year of creditable service with a 60 percent maximum. Average final salary calculated based on the last 10 years of service.
- 1971: Pension formula upgraded to 1.67 percent for first 10 years of service; 1.9 percent for next 10; 2.1 percent for next 10; and 2.3 percent for years over 30. Maximum percentage of FAS increased to 75 percent maximum. Average final salary calculation changes to highest four consecutive years within the last 10 years of service.
- 1998: Pension formula upgraded to 2.2 percent a year. TRS member contributions increased by 1 percent.
Sick leave benefits
Sick leave days in the private sector are typically treated as “use it or lose it.” But teachers and other government workers in Illinois can accumulate unused sick leave days over the course of an entire career – and then cash those days out when they retire by adding them to their years of pensionable service.
- 1972: Service credit granted for up to one-half year of unpaid sick leave.
- 1984: Service credit granted for up to one year of unpaid sick leave.
- 1998: Any unused sick leave could be used for credit, if not compensated in any other way.
- 2003: Service credit granted for up to two years of unpaid sick leave.
Retirement ages
Teachers can begin drawing pensions with full benefits while still in their 50’s. And a majority of teachers haven taken advantage of this rule. Sixty percent of teachers currently collecting a pension retired in their 50’s.
- 1947: Retirement permitted at age 55 with 20 years of service; age 60 with 15 or more years of service.
- 1969: Retirement permitted at age 55 with 20 years of service; age 60 with 10 or more years of service; age 62 with 5 years or more of service.
Appendix C. Details of teacher pension comparison
General methodology/assumptions
- Wirepoints calculated the benefits of career teachers with 30-plus years of service who retired in FY 2018. Average age at retirement, Final Average Salary, beginning pension benefit and cost-of-living adjustments were used to calculate total benefits in retirement.
- The U.S. Bureau of Economic Analysis’ Regional Price Parities Index was used to adjust for cost-of-living differences across states.5
- Assumed average total years of service: 34
- Assumed annual rate of inflation based on 30-year Expected Inflation as of June 2020: 1.8 percent. (Impacts state pension and Social Security COLA benefits)
- Assumed life expectancy: 84. (Based on Social Security actuarial life tables)
- Social Security benefits were included in the retirement benefit calculations for teachers in New York, Florida, Pennsylvania, Wisconsin, Iowa and Indiana. Teachers in Illinois, California, Kentucky, Missouri and Texas were assumed to not receive Social Security benefits.
- The Social Security Administration’s online “Social Security Quick Calculator” was used to estimate beginning Social Security benefits. Beginning benefits were based on teachers’ Final Average Salary and their age at retirement. All teachers on Social Security were assumed to begin collecting benefits at age 62 regardless of the age they retired and began to collect their pension benefit.
Source data
Career teacher benefit data was obtained from 2018/2019 Comprehensive Annual Financial Reports or individual FOIA requests to each state pension fund that manages teacher retirements.
State-specific data proxies/assumptions
Florida
- Teacher-specific data is not included in the Florida Retirement System’s public financial documents as teachers are classified as members of the state’s “Regular” class of retirees, which comprise a vast majority of the state fund’s pension membership. Wirepoints submitted a FOIA request to FRS for “retired members last employed by Florida school boards” to acquire specific pension, Final Average Salary and retirement age data for career, recently retired education employees.
- COLA estimate: Florida provides a 3 percent compounded COLA to members retiring after July 1, 2011 based on the following formula: Member’s years of service completed before 2011 / members’ total years of service * 3 percent = annual COLA benefit. Wirepoints’ Florida teacher worked 34 years in total with 27 of those years occurring before July 1, 2011; (27 years/34 years) * 3 percent = 2.4 percent annual COLA
New York
- COLA estimate: Wirepoints assumed an average annual 1 percent simple COLA during retirement (based on 1.8 percent average future inflation).
Texas
- COLA estimate: Wirepoints assumed a $2,000 annual benefit provided every 12 years based on the 13th check provided in 2019.
Pennsylvania
- Average retirement age: Wirepoints’ FOIA request for the average retirement age for teachers retired in FY 2018 with 30 or more years of service was denied by the Pennsylvania Public School Employees’ Retirement System. The average retirement age for all teachers who retired in FY 2018 was used as a proxy.
- COLA estimate: No COLA increase applied during retirement.
Wisconsin
- The average benefits for Wisconsin teachers are likely lower than what is stated in this report as public school teachers, university professors and technical college professors are all classified as “teachers” by the Wisconsin Retirement System. The WRS was unable to provide Wirepoints with a more detailed data breakdown comprising just K-12 public school teachers in its returned FOIA.
- COLA estimate: The annual COLA provided to WRS retirees can vary significantly from year to year as it is based on the investment return performance of a “Core Trust Fund” and an optional “Variable Trust Fund.” Wirepoints’ Wisconsin teacher is assumed to only enroll in the “core” fund and is assumed to receive a 1 percent compounded COLA in retirement based on the average annual benefit provided to members over the 2000-2019 period: 0.9 percent.
Missouri
- COLA estimate: Missouri provides a compounded COLA benefit ranging from 0 percent to 5 percent based on the rate of inflation: Under 2 percent inflation, no COLA but inflation is cumulative with next year, resetting to zero after a COLA benefit is provided; 2 percent to 5 percent inflation, 2 percent COLA; 5 percent or more inflation, 5 percent COLA. Based on an average future inflation rate of 1.8 percent annually, Wirepoints assumes a 2 percent COLA every other year for a retired Missouri teacher.
Indiana
- The Indiana Public Retirement System (INPRS) denied Wirepoints request for pension and salary data for recently retired career teachers. Wirepoints used the available data for the Teachers’ Pre-1996 Defined Benefit Account in INPRS’ 2018 Comprehensive Annual Financial Report for its estimates. Wirepoints multiplied the average “Final Average Salary,” “Average Monthly ASA Annuity” and “Average Monthly Defined Benefit” for all career teachers as of 2018 by 120 percent to serve as a proxy for the benefits of career teachers who retired in 2018. Wirepoints’ multiplier of 120 percent is based on the average difference between the benefits of “all teachers with 30-plus years of service retired as of 2018” and “teachers with 30-plus years of service who retired in 2018” of the other surveyed states.
- Indiana teachers also receive retirement benefits from a 401(k)-style account as part of INPRS. Those payments are included in their total pension benefit.
- COLA estimate: An Indiana teacher is assumed to receive an annual compounded COLA of 0.4 percent to 0.6 percent based on the assumptions used in INPRS’ 2018 Actuarial Valuation Report.
Iowa
- The Iowa Public Employees Retirement System denied Wirepoints’ request for final annual salary data of “Education-classified” retirees. Wirepoints multiplied the average “High Average Salary” for all career retirees as of 2018 by 120 percent to serve as a proxy for a recently-retired career teacher’s final salary.
- COLA estimate: No COLA increase applied during retirement.
 Audio and summary
  If this bill passes, say goodbye to local control over all Illinois parks and expect to see open drug and alcohol use, needles, no sanitation and fire hazards, but no ordinary park users.
How about we just close the pension funds and give each retiree or current worker a pro-rata share of what’s actually there. Some retirees could get multi-million dollar checks in some IRA type account. What obstacle’s are there legally for this arrangement? At least gov’t employees would be able to realistically make a plan. It seems to me that a lot of retirees and employees are making plans based on current payouts with the assumption that it’s a promise (and will actually be there in 20 years). The younger employees would have the most to gain, cause at this rate,… Read more »
Hopefully you might already know that your proposal won’t let the state of IL off the hook for paying public employee pension promises out of its general revenues. The courts ruled to that effect roughly five years ago. Its the STATE that owes the public employee pensioners their annuities rather than any entity they create to do so. I know the counter arguments well enough, too, as likely do 80-90% of the other posters here. “You can’t get blood out of a turnip” is the essence of it. I don’t disagree that “something” will have to be done in view… Read more »
Nice Florida Luxury homes, cars and boats on the poor honest hard working taxpayers.
Illinois is a goner, DOA. Greed of cops, teachers and firemen have destroyed it for generations to come. Leave ASAP, best day of your life.
Illinois “Land of Slavery”
EMPLOYER COSTS FOR EMPLOYEE COMPENSATION - MARCH 2020 Employer costs for employee compensation for civilian workers averaged $37.73 per hour worked in March 2020, the U.S. Bureau of Labor Statistics reported today. Wages and salaries cost employers $25.91 while benefit costs were $11.82. Total compensation costs for civilian workers were $13.15 at the 10th wage percentile, $28.40 at the 50th (median) wage percentile, and $74.17 at the 90th wage percentile. (See tables A and 1.) State and local government worker compensation costs for employers averaged $52.45 per hour worked in March 2020. Wages and salaries averaged $32.62 and accounted for… Read more »
EMPLOYER COSTS FOR EMPLOYEE COMPENSATION – MARCH 2020. pdf.
“Comparisons: Compensation cost levels in state and local government should not be directly compared with levels in private industry. Differences between these sectors stem from factors such as variation in work activities and occupational structures.”
Ha,Ha,Ha, I don’t know what happened to all the chickens…I stood guard all night. Signed T he Fox.
Here ya go – Public school union teachers are overcompensated by 52% relative to their peers in the private sector:
http://www.michaelrobertson.com/archive.php?minute_id=357
It all depends upon how you define “peers.” That’s where it really deep ends intellectually.
Peers for public school teachers would be postal carriers, convenience store/ fast food, coffee shop managers, home health aides, counselors, social workers.
You’re entitled to your opinion, of course. Sorry for how you were mistreated.
Just curious. Would you define public school “peers” with K-12 private schools teachers? My son went K-8 in private school (Lutheran). I asked some of the teachers and principal (salary about 1/2 of public) why they don’t teach at public schools due to better compensation and benefits. Without hesitation said that they love what they do and money was not high on their list as a motivation. They easily qualify to teach at public but choose private. My son received a great education and is now a minister in PA. Really proud of him. Tuition was not to bad and… Read more »
I have no trouble with your using private school nor private school teachers themselves. But, there are two points I think need mentioning here. While there may well be exceptions in general public school teachers have to meet certain standards and course content requirements that private school teachers aren’t required to do. Consequently, most private school teachers likely are not certificated by the state unless they’ve done the extra steps required for it. That’s not to say they are better or worse for having that extra qualification, but I state it as a fact for your consideration. On the other… Read more »
Thank You! I am trying to compare some our local K-12 schools here in Rockford which on average charge approx $7K in tuition vs Rockford dist 205 At $14K+. The exception being Keith school which is the upper end private K-12 at around $13K. Teacher/student ratio there is 7-8 to 1 and over 98% go to college probably of their choice. Mostly doctors and lawyers kids go there although they have scholarships available. Bottom line kids should get the best education possible at the best price regardless of being public or private. They are the future and our replacements. P.S.… Read more »
If you think private school teachers are superior in their knowledge I’d say you are wrong on average for the reasons I mentioned earlier. But academic preparation isn’t the entire ballgame for teachers, is it? Passion for the work of the job and personality traits such as selflessness play a heavy role, too. I’m only guessing here, but my bet on the selfless part favors the private school teachers. Passion for the job may or may not favor them as well, but I suppose that also favors them to a lesser degree since clearly they are doing the job for… Read more »
I agree that many public schools are excellent. My son did go to public for high school and was senior class president. Never meant to imply that they are superior but they are not inferior. Either way both schools must comply with state mandates for the curriculum. There is no upper limit to per pupil expenditures on the state level but there is a minimum (approx $6,500) mostly in rural areas or small towns. They still get an education equal to schools districts where $30K per pupil is needed to pay for massive administrative bloat There is choice where parents… Read more »
Some good thoughts there, Freddy!
Wow. 31 comments in one day. Clearly Wirepoints has struck a nerve among the obscenely entitled and deeply greedy public sector union members. They feel that they have earned there criminally achieved benefits. The politicians that they successfully bribed have “legally” carved out massive theft from the taxpaying chumbolones so dammit this money is theirs. They stole it fair and square.
Fellow Wirepoint readers, the time has come to stop being angry and accept what you can’t change. Wirepoints isn’t going to fix Illinois for you. Accept it. You can either stay or leave. It’s that simple. If you stay, fine, but keep in mind things are only going to get worse. If you leave, fine, but learn from experience and avoid liberal states.
This is truly the only “answer”, as decline/collapse/crash is just a matter of probability. It is hard to predict when but we are at the stage of reasonably sure it is within 3-5 years and CERTAINLY this decade.
As for me, I’m a professional and yes I’ll be leaving within the year.
A smart, rational response given the situation…and I think the Wirepoint staff would agree.
I agree but where to go? Leaving Illinois is like being rescued from the Titantic only to discover you were picked up by the Lusitania. (I know different years) Other states have a plethora of their own problems. West coast is burning-Arizona is under almost daily excessive heat warnings-Florida and gulf coast with hurricanes and sea level rise/flooding-Colorado is 100 degrees one day and snowstorm another-Wisconsin has too many Packer fans-Ha! Ha! Lifelong Da Bears fan. Now riots and civil discourse everywhere and more to come. Where To Go?
Freddy, you can drive yourself crazy looking for “perfect.” Just find a place that feels like it fits, visit, do some research, and take the plunge. My family and I did that two years ago, and we are still finding things to love about our new home. You won’t regret it-even if it is 100 degrees one day and snowing the next!
“Home is where your heart is” even if your derriere chooses to sit elsewhere.
A comment below argues that teachers’ benefits are not overly generous comparative to “professionals “: “In looking at pension benefits andcalling them overly generous, the report fails recognize that most of the employees are professionals (lawyers, teachers, engineers, etc.) to factor in ALL of the elements of employee compensation such as comparative pay scales (public to private), comparative state costs of living, and the competitive difficulty in attracting an effective qualified workforce.” It is a good idea to consider comparison between teachers and nurses (nurses being professionals who compare most closely to teachers in terms of education required to enter… Read more »
There is a lot to unpack here. Part of what you say is true, but some is not for IL teachers either through speculation on your part, circumstances that apply in some contracts but not generally or because for all I know you are talking about situations that apply in other states. Now, let me be specific: In your introduction “It is a good idea to consider comparison between teachers and nurses (nurses being professionals who compare most closely to teachers in terms of education required to enter the profession–engineers and lawyers require advance degrees and STEM skills rather than… Read more »
Shilling again with no solutions proposed. I am a Mechanical Engineer, I work well beyond 2000 hours per year, and, on my own time, I’ve attained a PE license. I fly around the world, taking industry specific training, putting me beyond the Phd / Professional level of training. None of this with any union protections or hand holding. I work hard, so as to get paid well. And there is real competition, all the time. I’m also essential, therefore no Zoom existence for me. Cry me a river as to working “off the clock”, at home. Life isn’t fair. And… Read more »
Wow, there partner! It wasn’t the intention of my posting to suggest solutions. I was simply trying to clarify the issues Susan had raised in that a few of her comments were right without argument, some might be right and others were definitely not right. I wasn’t trying to compare a teacher’s work hours or career to yours, so the “cry me a river” comments seems utterly ridiculous because you seem to have taken what I said as a comparison to your and your career. It wasn’t! I was simply trying to describe the true “work hours” for teachers while… Read more »
Nailed it. Simple, straight truths that hit hard and everyone knows is true.
That’s “everyone minus 1” at least.
I din’t necessarily disagree. I just think we all need to compromise to the benefit of all. Folks here din’t want that and tend to be hateful to public workers based upon limited personal experience, never having done it in most cases and, therefore, speaking in what they project as an authoritative way when engaging in things only remotely in their knowledge system. People have always been that way, I have to presume. You see it when people shout, for example, projecting the attitude that the louder the voice and/or the last voice heard carries the strongest logical argument apparently.… Read more »
I hope that you are right about wanting compromise. That is something we never hear from public sector unions. They seem to believe that a clause in our state Constitution will somehow produce the money to fund these benefits. “But you promised” does not get us any where.
The current system is obviously not sustainable and must be changed.
Public sector unions are heading for disaster. Those of us pointing out the problems are trying to avert that disaster for you public union members. Why are the unions not doing the same?
I really mostly want a sense of what’s reasonable given not only the current state’s finances but what’s at stake long term if we all ignore reality. Does anyone doubt for a minute that IL is circling the drain in terms of its financial security both governmentally and for its citizens personally, too? This “we’re right and they’re wrong” attitude projected here daily is leading to no sensible resolution to that set of problems. IL public pensions by law are considered contract, meaning they require give and take on each side. Surely reasonable people can find a way out of… Read more »
Right .. Orange Man Bad. Gotcha, that’s the crux of all these issues.
Strawman some more, nothing comes of it.
That’s the problem; NOTHING comes from anything on this forum. Its simply a place for venting with like-minded people. If there’s progress to be made it needs to go to a wider group where people of opposing opinion are somewhat more equally distributed and willing to debate. Everyone here simply agrees over and over and over again but to no obvious good result!
James – Did you mean to post this on Capitolfax?
To compare what passes as a public school teacher in Illinois to a RN, Engineer, or Attorney is laughable.
I agree but likely for different reasons. Its simply not totally logical–partially logical maybe.
So what did Chicago Democrats get in return for all this public employee largesse?
Both political parties statewide are responsible for the state pension mess.
Politicians get votes, manpower for political campaigns, and money for political campaigns.
Just raise taxes. If you do not like it MOVE.
Illinois “Land of Slavery”
Who’s fault or why really doesn’t matter if we can’t do pension reform we have to do salary reform.
Everyone needs to take a 10% cut in salary to fund their generous pensions.
Tell that to the Chicago teachers that just got gigantic raises that will only amplify the pension problem.
Layoffs and furloughs (no work, no pay for a set period of time) are more likely at least with group of politicians currently in office.
An interesting thing to look at is the last or final year of salary. Is it calculated on the base pay of the employee or all pay to include overtime. If overtime is included it would be interesting to see how many employes game the system the last year to gain an outsize pension.
Lots do and lots more will do.
The best scam is to get disability pension and pay no federal income taxes.
Government people (not workers as they do not work) think the poor honest working taxpayers are meant to be screwed over.
And they are in Illinois.
The pension is typically calculated from final average salary.
There is Tier 1 and Tier II.
Tier 1 is those employed prior to January 1, 2011.
For Tier 1, final average salary is typically the highest 4 years worked of the last 10 years, which is generally the last 4 years worked, and includes salary, overtime, bonus, etc.
The exact rules vary by pension system.
Clarification.
Tier 1 is those whose first day of employment was prior to January 1, 2011.
Every reader should forward this research to every school board member in their own taxing district. School board members’ reactions will define their motives and characters. 1. They refuse to even look at these data: I must conclude that if they are so lazy as to avoid reading source-cited research ( after summoning the energy it took them to run for and win public office), they must be indifferent to the economic destruction they are causing their neighbors. Sociopaths. 2. They read the data and ignore it all without bothering to specifically refute it: that is flaunting deliberate, overt, self-serving… Read more »
What a piece of garbage. This is a piece obviously intended to paint a negative picture of career state employee benefits, but it a dishonest one. There is much mention of accrued liabilities and their growth of 8.5% and then somehow creating charts of “benefit growth” to accrued liabilities (funding shortfall). Twisted – Accrued liabilities are NOT benefit growth. The truth of the matter is that employees have paid into the system the prescribed amount deducted from every paycheck. The state has had “pension holidays”, The report does point out that pension fund earnings have been good, better than most.… Read more »
Martin Anderson – interesting perspective. I read your piece is that the rent seekers in Illinois simply will not let go of their pension benefits, even with numbers that don’t remotely work and with a Constitutional amendment. Again, something to consider. The state pension shortfall which you suggest be subject to long term re-financing – which rating systems estimate to be $250B or more – not including health benefit liabilities – is 6 times the annual budget of the State – and that budget is illusory because Illinois does not have balanced budgets and runs at a deficit. So you… Read more »
“The biggest failure of this report is that it is merely a rant against the pension systems rather than a reasoned look at how to correct the problem for the state.” — Can you please show data which specifically rebuts the claims of the author?
“Far better to find a reasonable workable solution now, such as a long-term re-financing of the shortfall...” — I can’t in good conscience put the onus of payment on our kids and grand-kids, as I consider it an immoral form of usury. Can there be no compromise with regards to pensioners’ benefits?
Mr. Anderson, you are dead wrong on every single count: The “reasoned look” you claim we omit has been laid out here many times and will be detailed in the remaining parts of our 70-page report. It includes a state constitutional amendment which your side repeatedly and dishonestly claims won’t work. It also includes specific scenarios for reforms after the amendment, scored by actuaries. Your claimed concern for attracting quality new hires is outrageous. They get Tier 2, which is a huge deterrent to public service, forcing them to pay more than needed to fund their own benefits, and the… Read more »
“It is difficult to get a man to understand something, when his salary depends on his not understanding it.” … Upton Sinclair
Keep squeezing the lemon Tovarishch, you’ll get something from the dry husk of a rind eventually.
Accrued liabilities includes funded and unfunded liabilities, benefit hikes, salary hikes, etc. The interest on the unfunded liabilities is a huge problem. Hiking benefits while pensions are underfunded, which has always happened to the 5 state pension funds since they were always underfunded, is a huge problem. The interest on the benefit hikes is a huge problem. The pensions were grossly mismanaged. The employees did everything they were asked to do. So did the taxpayers. The Ralph Martire CTBA refinance plan is akin to the Edgar ramp which was akin to the Thompson Ramp. It didn’t work then and it… Read more »
Long term refinancing…something similar to the Edgar Ramp?
My comment is regarding the Chicago PD pension plan which is seriously underfunded due to several reasons. First, the City took pensions holidays where annual pension payments were skipped or reduced. Promises of pay raises, benefits, and pensions payout improvements were part of the deal. As a result a skipped payment of say $100 million after 30 yrs turns into several hundred millions assuming a return of 6 or 7% on investments. Do this a few times and its billions of $$$. Daley the second, managed to give his nephew and politically connected partner a loan of approx $70 million… Read more »
Nice Florida Luxury homes, cars and boats on the poor honest hard working taxpayers.
Illinois is a goner, DOA. Greed of cops, teachers and firemen have destroyed it for generations to come. Leave ASAP, best day of your life.
Illinois “Land of Slavery”
You’re an idiot