
By: Ted Dabrowski, Mark Glennon and John Klingner
Download a PDF copy of the report
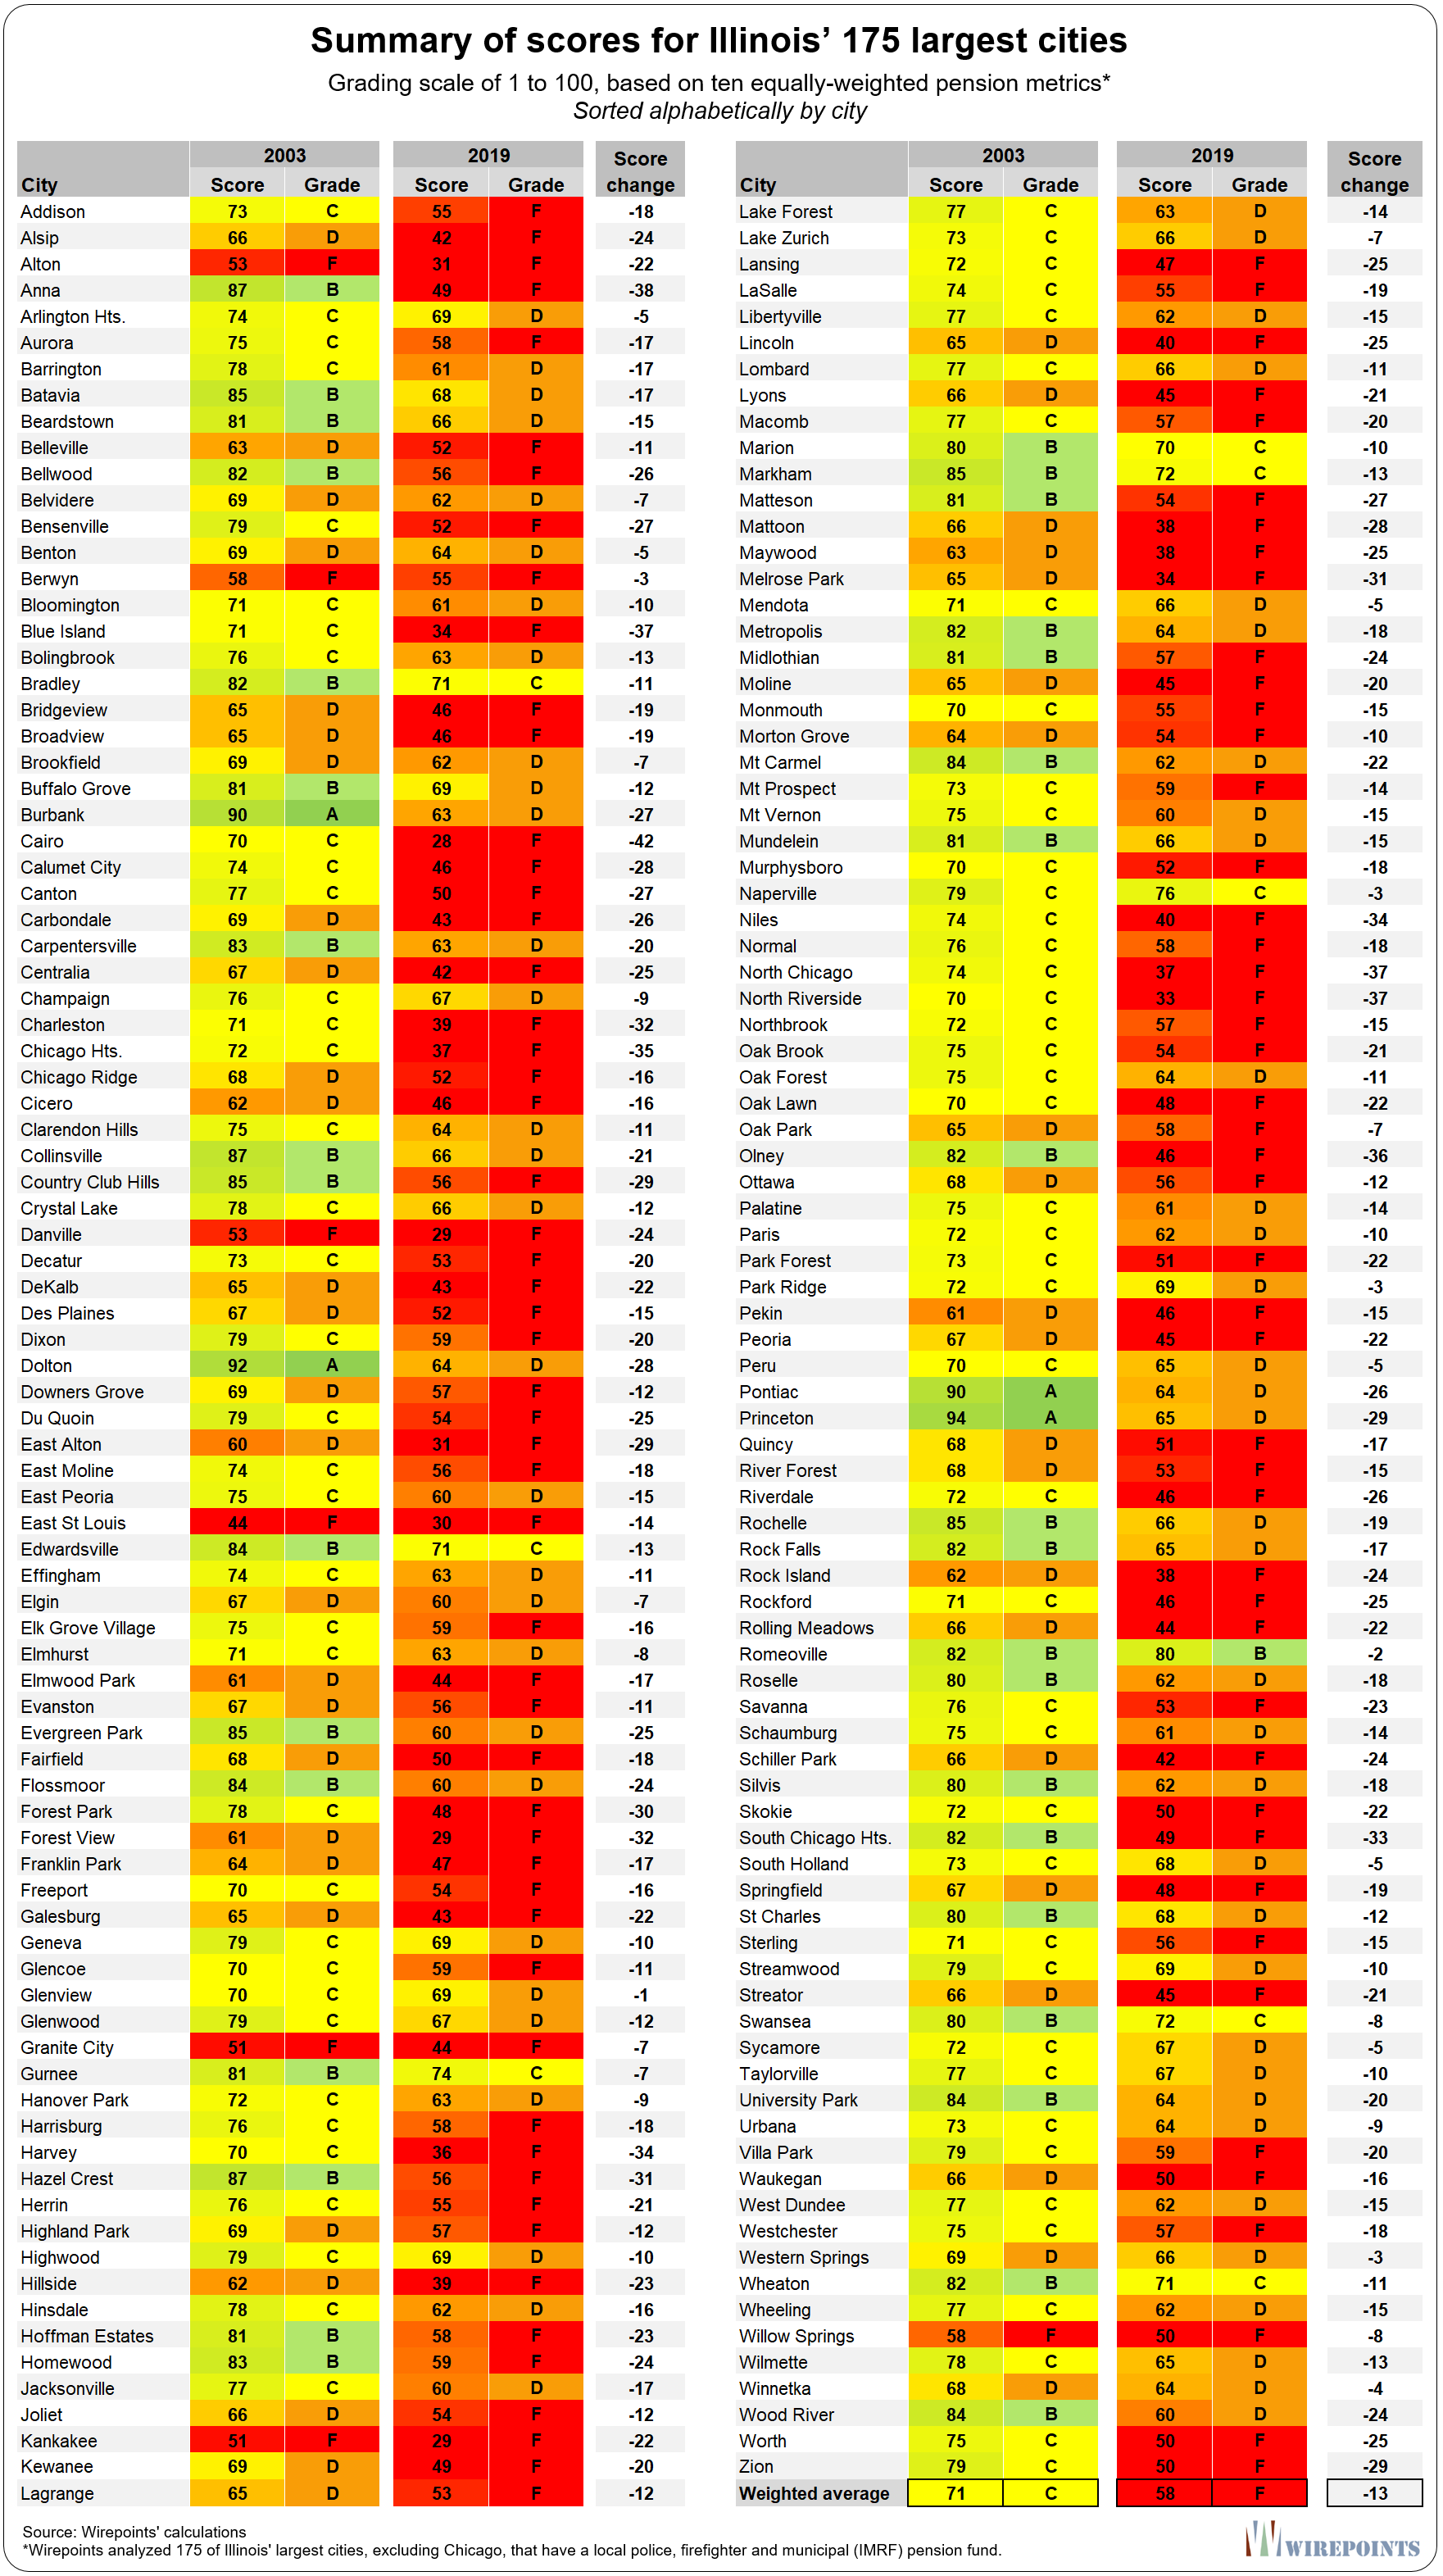
Addendum A. Summary scores and data for all 175 cities
Addendum B. Individual factsheets for all 175 cities
The negative impact of Illinois’ local pension crisis
Illinoisans are suffering from more than just the nation’s worst state-level pension mess. For most residents, another problem hits much closer to home: Illinois’ local pension crisis.
Wirepoints has quantified the negative impact of local pension costs by examining the finances of Illinois municipalities from 2003 to 2019. To allow for a like-for-like comparison, coverage was restricted to the 175 cities, excluding Chicago, that have their own independent police, firefighter, and Illinois Municipal Retirement (IMRF) pension funds.
Wirepoints found that while just seven of the 175 measured cities received an F grade in 2003, that number had grown to 102 cities by 2019.
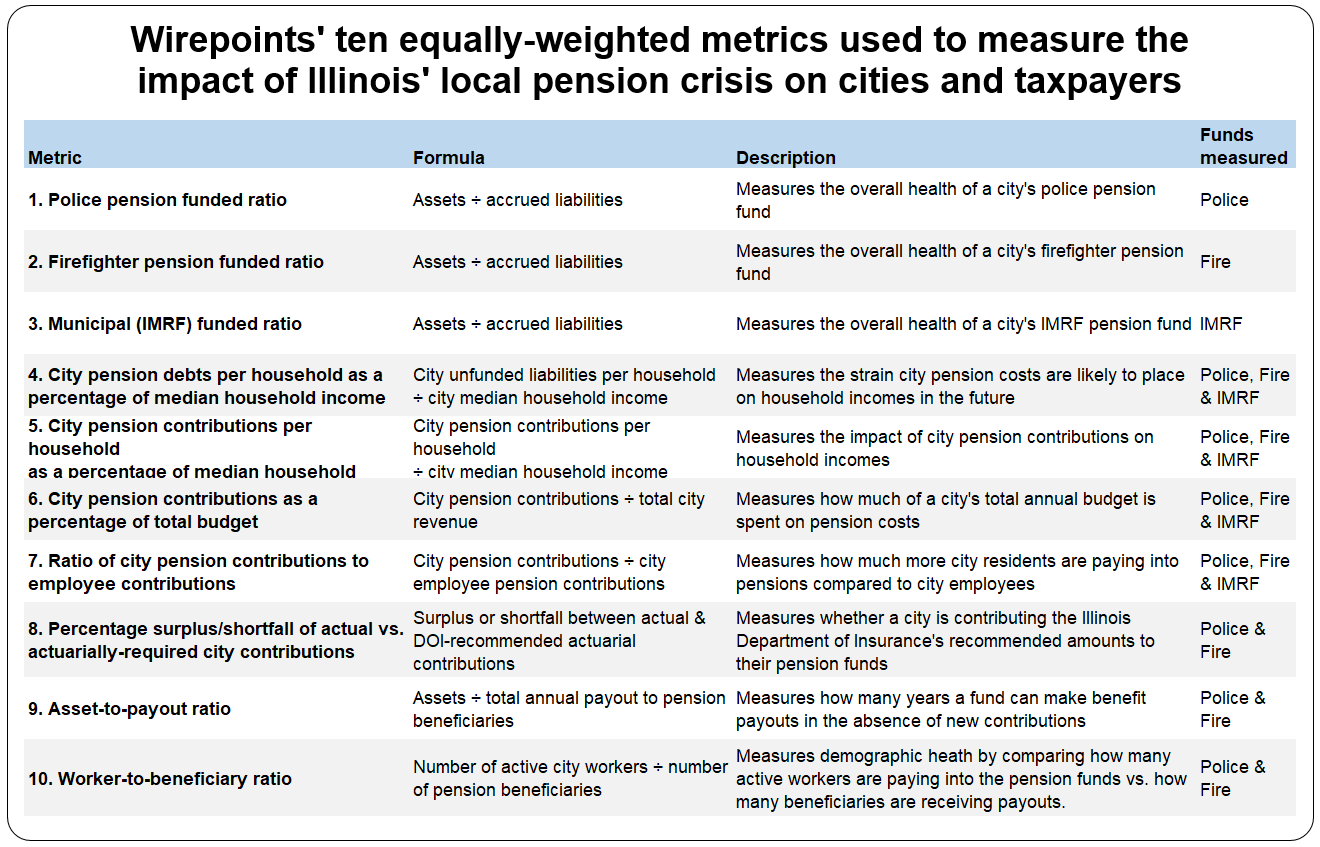
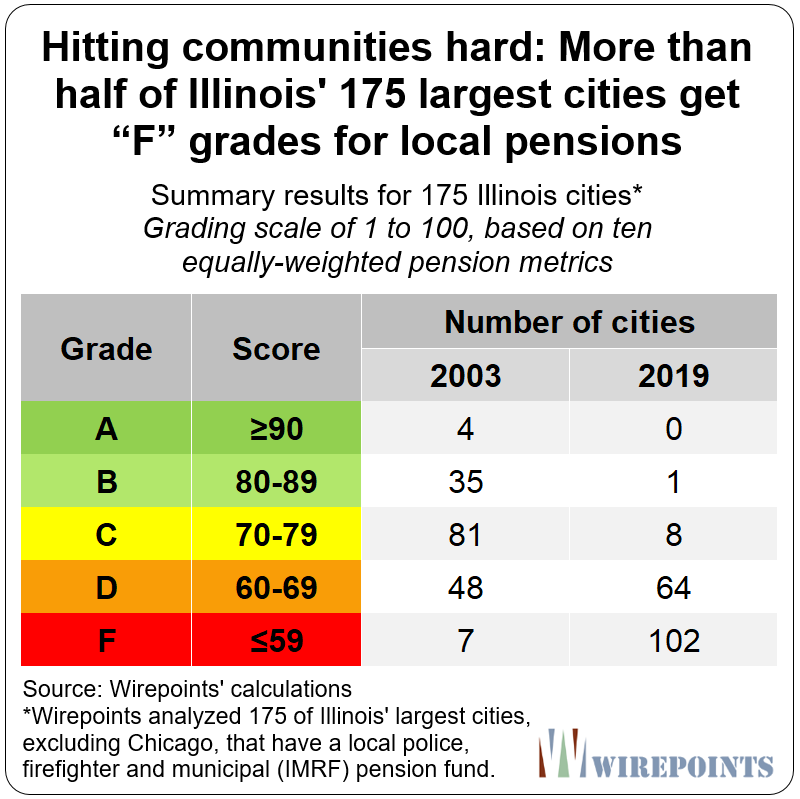 Our analysis was based on ten equally-weighted metrics, ranging from the funded ratio of each local pension system, to the pension debt each household is on the hook for, to the share of city budgets consumed by pension costs. All cities were given an A through F grade based on a 100-point scale (10 points per metric), with 100 being the best score. Wirepoints’ analysis was based on data from the Illinois Department of Insurance, the Illinois Comptroller and the U.S. Census Bureau.
The results of our analysis confirms what Illinoisans already know: the local pension crisis is wreaking havoc on taxpayers, core city services, and government-worker retirement security.
 Complicating the situation is the fact that local officials can do little about the crisis. Local retirement costs are largely a consequence of the state’s top-down, one-size-fits-all mandates which prevent cities from actually solving their pension problems.
Instead, city officials are forced to choose between three undesirable responses: raising taxes, cutting back on services, or endangering the retirements of city workers.
Springfield, for example has laid off more than 40 police personnel over the last decade as pension contributions now consume the entirety of the city’s property tax dollars. Alton sold off its water treatment facility in 2018 for $54 million to help pay down the $113 million owed to its police and fire funds. Mount Prospect “fell behind on street maintenance” as it was forced to make tradeoffs between pensions and core services.
Other cities are raising taxes and fees to try and keep up with pension expenses. Du Quoin recently hiked property taxes by 15 percent to avoid layoffs. Some cities, like Danville and Peoria, have created new “pension fees,” while others, including Bloomington and Elk Grove, have added new utility taxes to try and cover the growing costs.
What’s happened in the City of Peoria best captures the pain felt across the state. Wirepoints gave the municipality a score of 45 and an F grade for 2019. It’s not hard to see why.
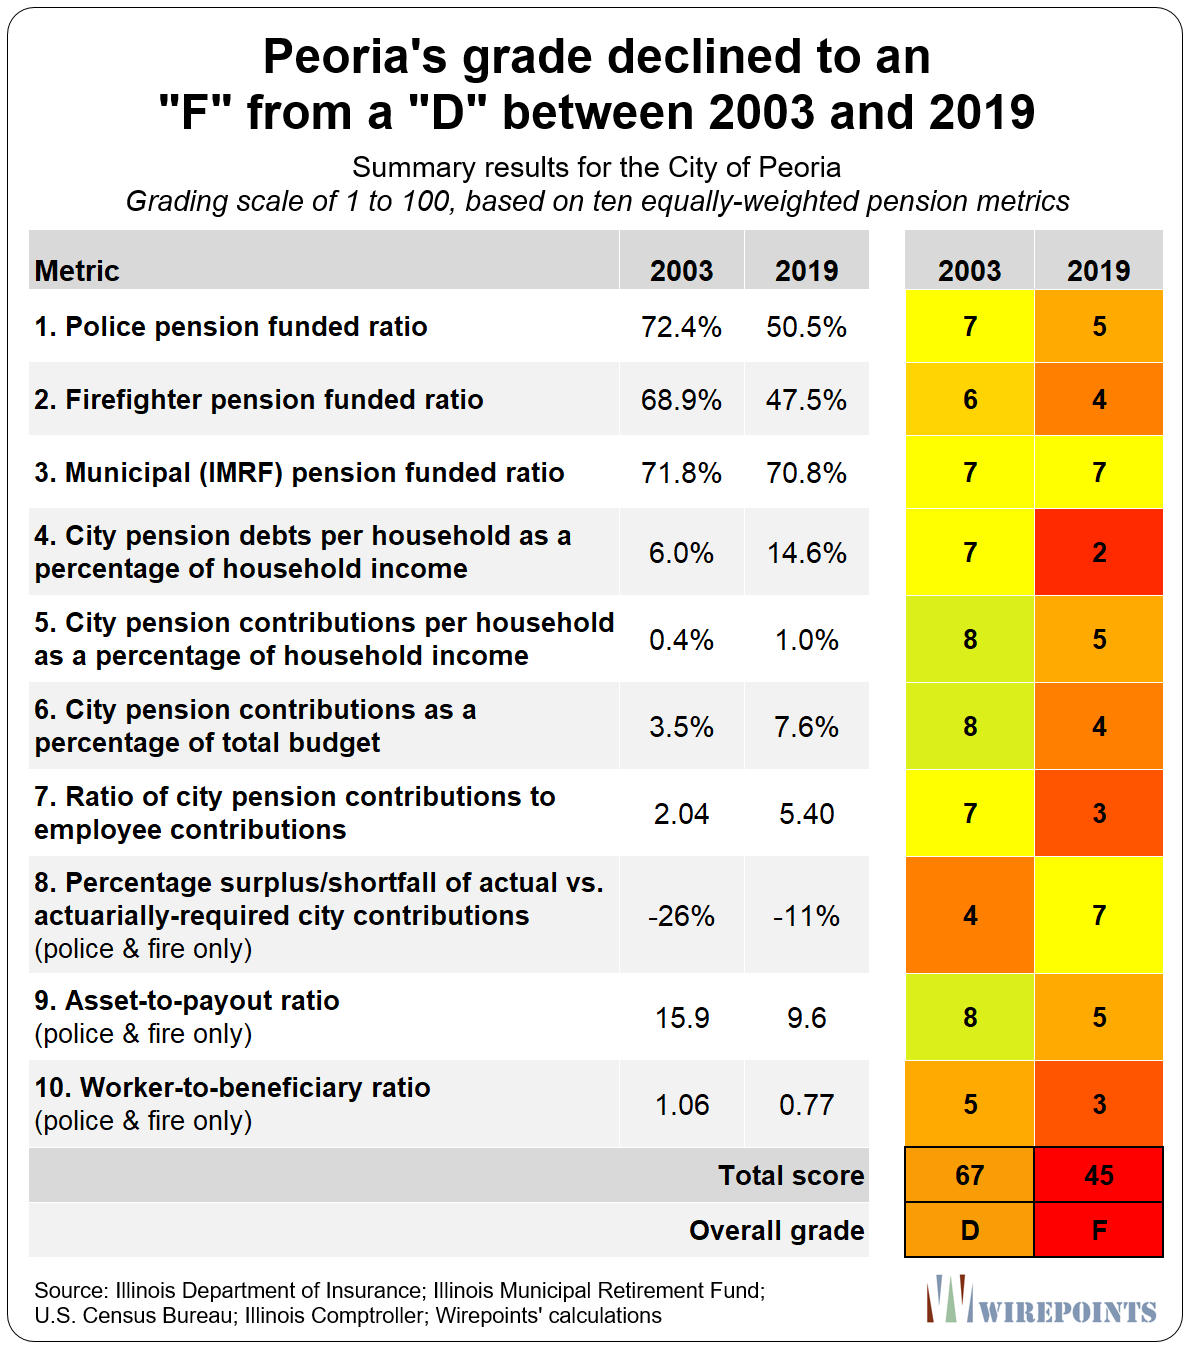 The funding ratios of the city’s police and firefighter plans have collapsed by over 20 percentage points since 2003, to just 50 percent funded today. That’s despite ever-growing city contributions that are now three times larger than they were 16 years ago.
Even more damning, residents are on the hook for 3.5 times more in pension debts today. The city’s total pension shortfall has jumped to $350 million from $98 million in 2003.
The city has also seen pension costs double as a share of its annual general budget, to 24 percent, even though it has raised taxes and fired dozens of public safety and other city personnel to make room for those higher costs.
And the city’s pension funds are harder to prop up now that Peoria has more retirees drawing pensions from the plans than active personnel contributing to them. The city has just eight active workers remaining for every ten beneficiaries. In 2003, Peoria had 11 active workers for every ten beneficiaries.
The same story of bigger debt, higher taxes and worsening retirement security is playing out in communities across the state.
Key Findings
The key findings of Wirepoints’ analysis include the following:
Key finding No. 1. An alarming number of municipal pensions have moved closer to insolvency in just 16 years.
In 2003, just 21 of the 175 cities analyzed had less than 60 cents on hand for every dollar they needed to fund the future benefits of their police, firefighter and IMRF funds. A 60 percent funding level is often seen as a point of no return, or a tipping point, from which pension funds can’t recover.
By 2019, 99 of the 175 cities Wirepoints analyzed were below the 60 percent funding level.
 Key finding No. 2: City taxpayers have paid increasingly more into pensions over the past 16 years, and yet the pension shortfalls they are on the hook for are far larger today.
In 2019, taxpayers in the 175 cities poured nearly four times more into pensions than they did in 2003: nearly $1 billion today vs. $250 million then. That’s a compounded growth rate in yearly city contributions of 9 percent.
Despite that quadrupling in payments, pension debts more than tripled over the same time period. In 2003, the total pension shortfall for the 175 cities was $3.4 billion. Today, that shortfall has grown to $11.8 billion. That’s like paying more and more into a mortgage, only to watch the balance balloon in size.
 Residents in 129 cities are now on the hook for more than $4,000 per household in combined local pension shortfalls. In 2003, only eight cities imposed such a burden.
Key finding No. 3: Taxpayers are being saddled with the entire increase in pension shortfalls.
Illinois laws don’t require employees to pay more toward their pensions when the funds experience shortfalls. Instead, the entire burden is placed on taxpayers.
In 2003, cities (i.e., taxpayers) contributed $250 million into pensions compared to $137 million by government workers. That was about 1.8 times more.
As the local pension crisis has worsened, the cost to taxpayers has soared. Now, cities are putting 4.4 times what local government workers contribute to the pension funds: $960 million vs. $217 million.
 Taxpayers in 156 cities now pay at least three times more to pensions than city workers contribute. By comparison, in 2003 taxpayers paid that much more in only five cities.
Key finding No. 4: Most local pension funds have turned upside down; they now have more beneficiaries than active workers.
Public safety pensions are becoming harder to keep afloat now that most cities have more pensioners drawing benefits than workers making contributions.
In 2003, 160 cities had more active workers than beneficiaries. Today, just 63 cities do.
 Key finding No. 5: Pension costs as a share of city budgets have doubled, increasingly crowding out core government services.
More and more of city budgets are being spent not on new services, but on services already rendered. Collectively, city pension contributions as a share of general fund budgets have more than doubled, growing to 17.3 percent in 2019 from 8.2 percent in 2003.
Pension costs as a share of total budgets (which include restricted fiduciary, enterprise and debt service funds, etc.) have also doubled, growing to 7.1 percent in 2019 from 3.6 percent in 2003.

Key finding No. 6: Nearly 60 percent of Illinois’ 175 largest cities received an “F” in 2019, up from just 4 percent in 2013.
Wirepoints’ analysis captured a significant decline in city scores between 2003 and 2019 across almost all metrics. In 2003, two-thirds of the cities measured received an A, B, or C grade. Only a third of cities had a D or F grade.
 By 2019, city scores had collapsed. No city achieved an A grade, and only 42 percent received a B, C or D grade. 102 cities, or 58 percent, had scores ranging from 28 to 59 and received an F grade.
The decline was largely driven by the drop in funded ratios, the increasing burden placed on city taxpayers in the form of larger contributions and growing debts, as well as the drop in the ratio of active workers to beneficiaries in the pension funds.
Key finding No. 7: Peoria was the state’s worst-off municipality among Illinois’ 20 largest cities; Naperville, the best.
Wirepoints’ analysis shows that while 12 of the 20 largest cities (excluding Chicago) achieved at least a C grade in 2003, by 2019 only one C grade city remained. Twelve cities received an F grade in 2019, compared to none in 2003.
The best-off municipality in 2019, with a score of 76, was the city of Naperville. The city of Peoria was the worst-off large municipality, with a score of just 45.

Other comments:
1. Most pension fund analyses focus primarily on funding ratios and unfunded liabilities, while credit rating assessments of cities are dedicated to measuring the probability of bondholders getting repaid. Both are helpful for assessing municipal risks, but neither capture the full impact the pension crisis has on cities and taxpayers.
Wirepoints’ analysis used ten separate metrics related to pension fund health, taxpayer burdens and city costs in an attempt to comprehensively capture Illinois’ local pension crisis. We recognize our methodology is just one of many ways to measure the depth of the crisis.
2.Wirepoints’ analysis used the most readily available data, which predates the COVID pandemic. Considering the economic and financial disruptions caused by the pandemic, it’s likely the local pension crisis is even worse today than the pre-pandemic numbers reveal.
3. The negative impact local pension costs have on cities and local residents cannot be considered in isolation. Illinoisans are also burdened with the costs of the state’s retirement crisis, the nation’s largest. In all, Illinois households are burdened with an overwhelming $420 billion in debt: nearly $90,000 per household, based on Moody’s Investors Service pension debt calculations.
Grading the impact of Illinois’ local pension crisis
Wirepoints’ analysis covers 175 downstate and suburban cities that contribute to independent police and firefighter funds, as well as to the Illinois Municipal Retirement Fund.
To track how much worse the local pension crisis has gotten over the past decade and a half, Wirepoints graded cities based on their financials in 2003 and 2019. Wirepoints chose those years because they are the earliest and latest years for which full individual police and firefighter fund data is publicly compiled by the Illinois Department of Insurance.
Wirepoints’ analysis used a 100-point scale (with 100 being the best score) based on ten equally-weighted metrics broadly covering three separate categories: pension fund health, taxpayer burdens and city costs. This was done to provide a more thorough review of cities and their pension funds, as no single metric fully captures the overall impact of the local pension crisis.
 In general, the lack of reforms at the state level has forced cities to choose between three undesirable responses: raising taxes, cutting back on services, or endangering the retirements of city workers.
For example, a city can minimize its pension contributions to keep pressure off of taxpayers, but this will cause pension fund health to worsen and resident debt burdens to rise over time. Conversely, a city can keep funding ratios high at the expense of taxpayer incomes and city services, potentially damaging the city’s tax base as residents move to areas with lower taxes and better services.
Wirepoints focused on metrics that capture the negative repercussions related to those choices.
Overall results of individual city scores
Most Illinois cities were already suffering from Illinois’ local pension crisis in 2003 – the earliest year individual police and firefighter fund data is available from the Illinois Department of Insurance – and their situations only worsened over the following 16 years.
- In 2003, a quarter of the cities measured (39 cities) received a grade of A or B, 46 percent (81 cities) received a C grade, and a third (55 cities) had a grade of D or F.
- East St. Louis had the lowest score (44) of any city in 2003, Princeton had the highest score (94).
- By 2019, city scores had collapsed. No city achieved an A grade, 9 cities received a B or C grade, and over one third (64 cities) received a D grade. Over one hundred cities, or 58 percent, had scores ranging from 28 to 59 and received an F grade.
- Cairo had the lowest score (28) of any city in 2019, Romeoville had the highest score (80).
- The city of Cairo suffered the largest score decline of 42 points, dropping its grade from a C to an F. Glenview suffered the smallest decline of 1 point.
 All the cities covered in this report had their overall score decline between 2003 and 2019. But not all experienced declines for the same reason.
Many cities have limited the size and growth of their taxpayer contributions over the years to lessen the impact on budgets and taxpayers’ incomes. But that’s caused pension funding ratios to fall and unfunded debts to grow.
Other cities, including Evanston and Joliet, have improved the health of their funds at the cost of pushing city contributions to a heavy level for both their budgets and taxpayers wallet. And a few municipalities, such as the city of Berwyn, have improved the health of their funds by borrowing money and putting the funds into the pension plans.
The fact that those cities’ pension funds are somewhat healthier than they were in 2003 is likely cold comfort to residents stuck with ever-higher tax bills, crowded-out services, or both.
Overall weighted results
Collectively, the 175 cities covered in this report suffered declines across nine of the ten metrics Wirepoints measured between 2003 and 2019.
- The collective funded ratio for police pensions dropped to 53.5 percent from 60.7 percent.
- The collective funded ratio for firefighter pensions dropped to 51.4 percent from 62.8 percent.
- The collective funded ratio for the cities’ municipal (IMRF) pensions dropped to 79.7 percent from 97.7 percent.
- The cities’ collective pension shortfall (unfunded liabilities) grew to nearly $6,100 per household in 2019, up from $1,800 in 2003. As a percentage of average household incomes, debts grew to 6.6 percent from 2.9 percent.
- The cities’ collective annual contributions to pensions grew to the equivalent of $494 per household in 2019, up from $134 in 2003. As a percentage of average household incomes, contributions grew to 0.53 percent from 0.21 percent.
- Pension costs as a percentage of cities’ collective general fund budgets grew to 17.3 percent in 2019, up from 8.2 percent of budgets in 2003. As a share of total budgets (including the general fund, special revenue fund, debt service fund, fiduciary funds, etc.) pension costs grew to 7.1 percent in 2019, up from 3.6 percent in 2003.
- The ratio of city pension contributions to employee contributions more than doubled between 2003 and 2019, growing to 4.4 from 1.8.
- Actual city contributions to police and firefighter funds compared to their actuarially required contributions is the only metric that improved between 2003 and 2019. Cities’ collective contributions in 2019 were only 3 percent lower than what the Illinois Department of Insurance’s actuaries recommended. That’s far better than in 2003, when contributions were 31 percent lower than recommended.
- The collective asset-to-payout ratio for city police and firefighter funds fell to just 11.8 years in 2019, down from 16.8 years in 2003. In contrast, well-funded plans from across the nation have assets worth at least 20 years of future payouts.
- The collective worker-to-beneficiary ratio for public safety funds was 1.5 in 2003. In 2019, the ratio had fallen to 0.9, meaning there were more beneficiaries receiving benefits than active workers paying into the pension funds.
 The crisis in Illinois’ largest downstate and suburban cities
Wirepoints’ analysis shows that while 12 of the 20 largest Illinois cities (excluding Chicago) achieved at least a C grade in 2003, by 2019 only one C-grade city remained.
Rockford suffered the biggest overall decline of 24 points between 2003 and 2019, enough to drop the city’s grade from a C to an F.
Naperville was the best-off large city with a score of 76 in 2019. The city’s pension funds are only marginally less healthy than they were in 2003 (though they are still far from the 100 percent funded they should be). The city, assisted by its growing high-income tax base, has managed to keep annual pension costs more affordable compared to other municipalities. Annual pension costs consume 4 percent of the city’s total budget (175 cities weighted average: 7.1 percent) and unfunded liabilities are equal to 2.5 percent of household incomes (175 cities weighted average: 6.6 percent).
The city of Peoria is the worst-off large municipality with a score of just 45. The city’s pensions are only half-funded, its debts are worth a sixth of household incomes, its annual pension contributions are five times higher than that of city employees, and it has just eight active workers for every ten pension beneficiaries.

Wirepoints’ ten scoring metrics
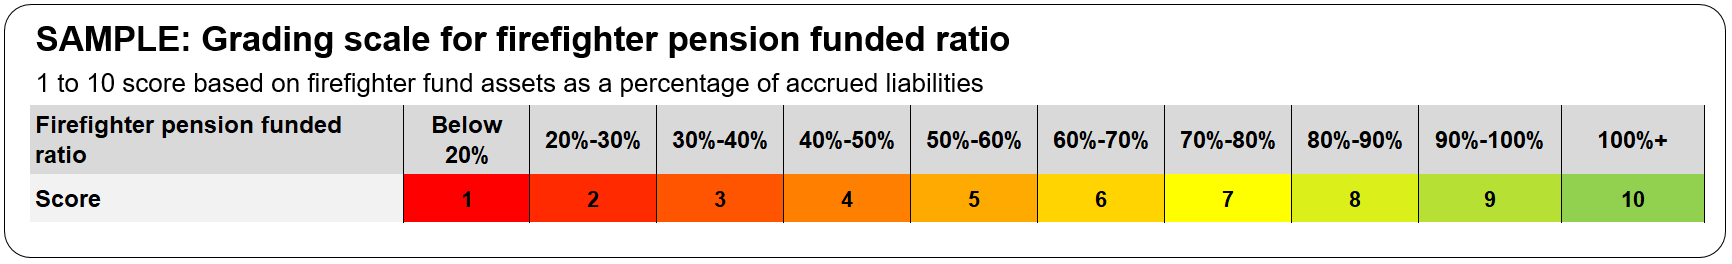
Scoring example
In the following section, Wirepoints covers the summary results of each of the ten metrics across the 175 cities measured. In addition, the individual scores of Illinois’ 20 largest cities are included to help illustrate how communities are negatively impacted by Illinois’ local pension crisis.
Cities were assigned a 1 to 10 score for each metric. For example, Metric 2 measures each city’s firefighter pension funded ratio, which is the most basic estimate of a pension plan’s fiscal health. Cities with a healthy pension plan – those at 100 percent funding or higher – receive a score of 10. Scores fall from there, with a score of 1 given to cities with firefighter plans at zero to 19 percent funding.
A city with a firefighter funding ratio of 65 percent, for example, receives a score of 6. Any city with a funding ratio below 20 percent receives the worst possible score of 1.
Metric 1: Police pension funded ratio
A pension system’s funded ratio is the most basic estimate of its fiscal health. The ratio measures how much in assets a fund has versus how much it needs to have to meet its future obligations.
“Pension plans should have a strategy in place to attain or maintain a funded status of 100 percent or greater over a reasonable period of time,” according to the American Academy of Actuaries. Illinois’ local police funds are in deep trouble based on that measure. 129 of the 175 cities analyzed by Wirepoints had police funding ratios below 60 percent in 2019.
That’s a marked increase from 2003, when 70 cities had funded ratios below 60 percent. A 60 percent funding level is often seen as a point of no return, or a tipping point, from which pension funds can’t recover.

 Metric 2: Firefighter pension funded ratio
Local firefighter pension funding ratios have declined even more than local police funds. Over the last 16 years, the number of cities with firefighter funded ratios below 60 percent has jumped to 119, from 47 in 2003.
The number of firefighter funds close to total insolvency tripled over the same period. In 2003, there were just 11 cities with firefighter funding levels below 40 percent. That number grew to 36 cities by 2019.

 Metric 3: Municipal (IMRF) funded ratio
Cities’ municipal worker pension plans, part of the Illinois Municipal Retirement Fund (IMRF), are better-funded than their police and firefighter counterparts, but are still far less healthy compared to 16 years ago.
In 2003, just 33 cities had IMRF funded ratios below 90 percent. By 2019, that number had climbed to 137 municipalities.

 Metric 4: City pension debts per household as a percentage of household income
Households in the 175 cities analyzed are each on the hook for $6,000 in local pension debts, on average, up from $1,800 in 2003. Their debt burden has more than tripled, meaning taxes can only increase going forward.
Of course, a household’s ability to pay those pension debts through higher taxes matters. For example, households in North Chicago and River Forest are each currently burdened with $10,000 in pension debt. That shortfall is a far bigger problem for residents in North Chicago (median household income: $43,094) than it is for residents of River Forest (median household income: $129,928).
To compare resident burdens across cities, Wirepoints divided each city’s per household pension debts by its median household income.
In 2003, 38 cities had pension debts equivalent to 5 percent or more of household incomes. By 2019, that number grew to 143 cities. And in 30 cities, household pension debts have grown to more than 15 percent of annual incomes.

 Metric 5: City pension contributions per household as a percentage of household income
City contributions to pensions nearly quadrupled between 2003 and 2019, growing to nearly $1 billion from $250 million. That’s the equivalent of $494 per household, up from just $134 in 2003. In some cities, the per household contribution has grown to more than $1,000 a year. Berwyn’s 2019 payments, for example, were the equivalent of more than $1,800 per household.
As with pension debts in Metric 4, a household’s ability to pay those pension contributions matters. For example, the cities of Alton and Lake Forest both contribute the equivalent of about $800 per household to pensions, but that payment is a far bigger burden for Alton residents (median household income: $40,211) than it is for Lake Forest residents (median household income: $172,165).
To compare resident burdens across cities, Wirepoints divided each city’s per household pension contribution by its median household income. In 2003, just 12 cities made contributions equivalent to 0.5 percent or more of resident household incomes. By 2019, that number had grown to 128 cities.

 Metric 6: City pension contributions as a percentage of total city budgets
Pension costs are crowding out spending on vital services in cities across Illinois. One way to capture the impact of that crowd out is to calculate how much of each city’s operating funds (general funds) are being consumed by pensions. Collectively across the 175 cities, pension costs as a share of general funds have doubled between 2003 and 2019, growing to 17.3 percent from 8.2 percent.
But since city finances have become more varied and complex over time, using the general fund does not always give an apples-to-apples comparison for how pensions are affecting budgets across cities.
Wirepoints has adjusted for that by measuring pension costs as a percent of each city’s entire budget, which includes other funds as well (special revenue, debt service, fiduciary funds, etc.). Under that measure, pension costs as a share of all revenues have still nearly doubled, growing to 7.1 percent in 2019 from 3.6 percent in 2003. Using the entire budget has its own caveat, however. It understates the true impact of pension costs because total budgets include revenues already dedicated to other expenses (such as debt service revenues dedicated to paying down a city’s general debt) that cannot be used to pay for pension costs. Either way, pension costs have doubled under both measures.

 Metric 7: Ratio of city contributions to employee contributions
Illinois laws don’t require government employees to pay more toward their pensions when the funds experience shortfalls. Instead, the entire burden is placed on taxpayers.
Measuring that increasing burden is possible by looking over time at the ratio of employer (taxpayer) contributions to employee contributions. In 2003, the 175 cities (i.e., taxpayers) paid $250 million into pensions vs. $137 million from government employees. That was about 1.8 times more.
As the local pension crisis has gotten worse, the cost to taxpayers has soared. Now, cities are putting 4.4 times what local government employees contribute to the pension funds: $960 million vs. $217 million.
In 2003, just five cities paid contributions that were three times or more the size of city employee contributions. By 2019, that number had grown to 156 cities.

 Metric 8: Percentage surplus/shortfall in actuarially required city contributions (police and firefighter funds only)
In 2003, 161 cities made pension contributions that were smaller than the Illinois Department of Insurance’s actuarially-recommended contributions. By 2019, that number fell to 108 cities.
That improvement in funding can be partially attributed to a 2011 Illinois law requiring public safety pension funds to reach 90 percent funded status by 2045. Cities that don’t pay their full actuarial contributions to their public safety pension funds each year are subject to a potential garnishment of tax revenues by the State Comptroller under what’s known as the “pension intercept.” For more information about how the local pension intercept law works and how cities are impacted, see Wirepoints’ special report: Will COVID-19 lead to “pension intercepts” and cuts to core city services across Illinois?
Cities today are still dealing with the fallout of that funding requirement. A majority of cities now make payments closer to or exceeding the DOI’s actuarial recommendations, but it’s coming at the cost of far higher taxes, reduced services and overwhelmed budgets.

 Metric 9: Asset-to-payout ratio (police and firefighter funds only)
The asset-to-payout ratio provides another basic estimate of a pension fund’s fiscal health. The ratio compares a fund’s total assets to how much in benefits it will pay out that year. In other words, it measures how many years of payouts a fund could make, assuming no new contributions into the fund. The bigger the ratio, the healthier the fund.
Healthy state and local public pension funds across the nation typically have assets on hand that can fund at least 20 years of payouts. Anything less than that likely indicates a problem with the size of a fund’s assets, its annual payouts, or some combination of both.
In 2003, 108 cities had a combined asset-to-payout ratio of less than 20 years. By 2019, that number had grown to 168 cities.

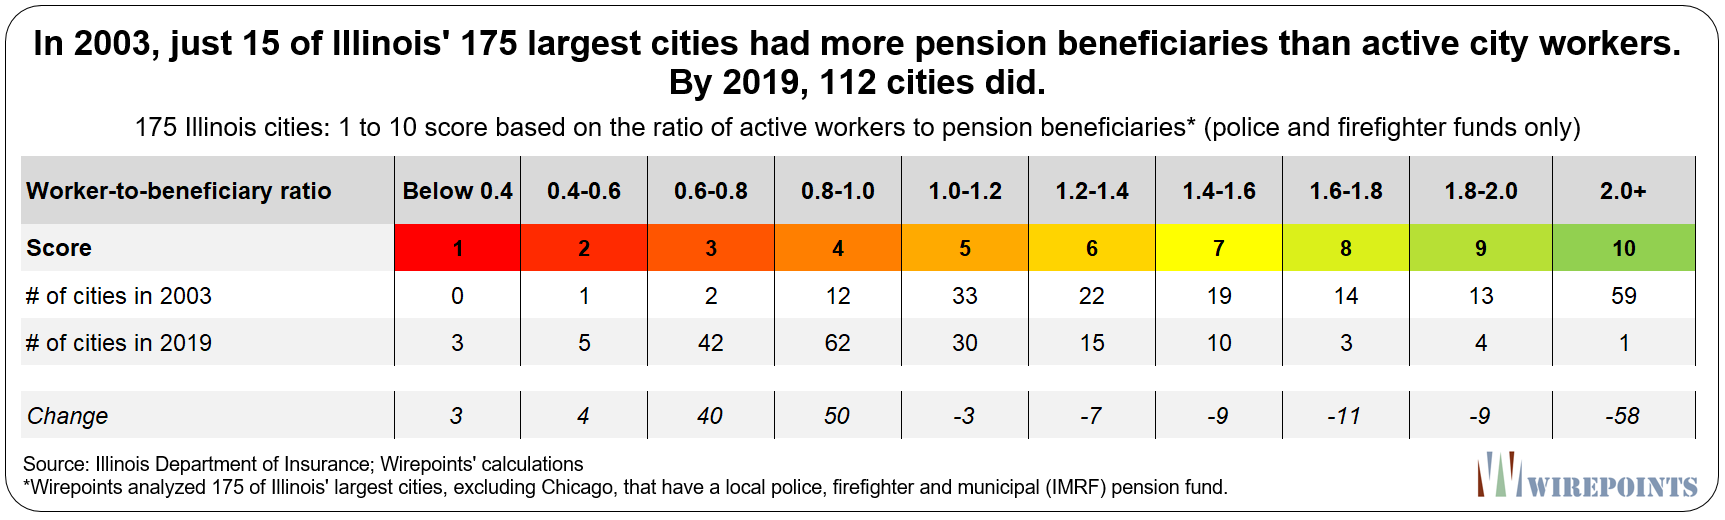
 Metric 10: Worker-to-beneficiary ratio (police and firefighter funds only)
Most local public safety funds of the 175 cities measured have turned upside down; they now have more beneficiaries than active workers.
The ratio of active workers to pension beneficiaries is a key measure of fiscal/demographic health. A pension fund is healthier when it has more active members paying contributions into the system than it does beneficiaries receiving payouts. In contrast, fewer active workers means cities (taxpayers) have to increase their contributions into the pension plans to keep them solvent.
In 2003, just 15 cities had more pension beneficiaries than active workers in their pension funds. By 2019, that number had grown to over 112 cities.
As pension costs rise and put more pressure on budgets and public safety headcounts, look for even fewer cities to be able to maintain ratios above 1.0.

Pension promises have grown faster than Illinoisans’ ability to pay
Illinois’ many pension crises are often blamed on underfunding, but it’s overpromised benefits by lawmakers that are the real cause. Wirepoints reported on the unsustainable growth of the state’s accrued liabilities in its recent report, Illinois Pensions – Overpromised & Overgenerous.
That overpromising has made Illinois the nation’s extreme outlier when it comes to state pension debts and their subsequent costs.
A similar analysis of local pensions shows that the liabilities of city worker pensions have also grown far faster than Illinoisans can afford.
For example, Illinois cities owed a total of $2.6 billion in total pension benefits (accrued liabilities) to public safety workers and retirees across the state in 1987. By 2019, that number had jumped to nearly $29 billion. That’s a total growth of over 1,000 percent, which translates to an increase of about 7.8 percent a year.
The Illinois Municipal Retirement Fund’s liabilities grew 949 percent over the same period.
By comparison, Illinois’ total personal income, a proxy for GDP, grew a total of 278 percent.
 Just like at the state level, neither budgets nor resident incomes could expect to keep up with the rapid growth of pensions stemming from the state’s top-down, one-size-fits-all mandates. The state controls the collective bargaining laws that handcuff local governments, leaving them no alternative but to accept expensive contracts. State lawmakers also set the rules for local pensions, limiting cities’ ability to control costs.
Of the five major components that impact an employee pension – the number of active workers, the number of inactives and beneficiaries, salary levels, rate of investment returns, and benefit levels – local officials have control over just one: the number of active workers employed by the city.
Of the other four, binding arbitration – or the threat of it – overrides city control of salaries. The market determines the funds’ investment returns. Local officials have little to no influence over the number of retirees drawing benefits.
And local governments can do nothing about the rules that allow Tier 1 workers to retire in their 50s with full benefits and get 3 percent cost-of-living adjustments that double yearly benefits after 25 years in retirement.
 In addition, Illinois’ collective bargaining laws grant most of Illinois’ government unions the power to strike. And for those that can’t strike, the unions can demand that an unelected, independent arbitrator step in.
Those rules have helped grow government worker salaries in Illinois at a far more rapid pace than the earnings of those who bear the burden of paying for them.
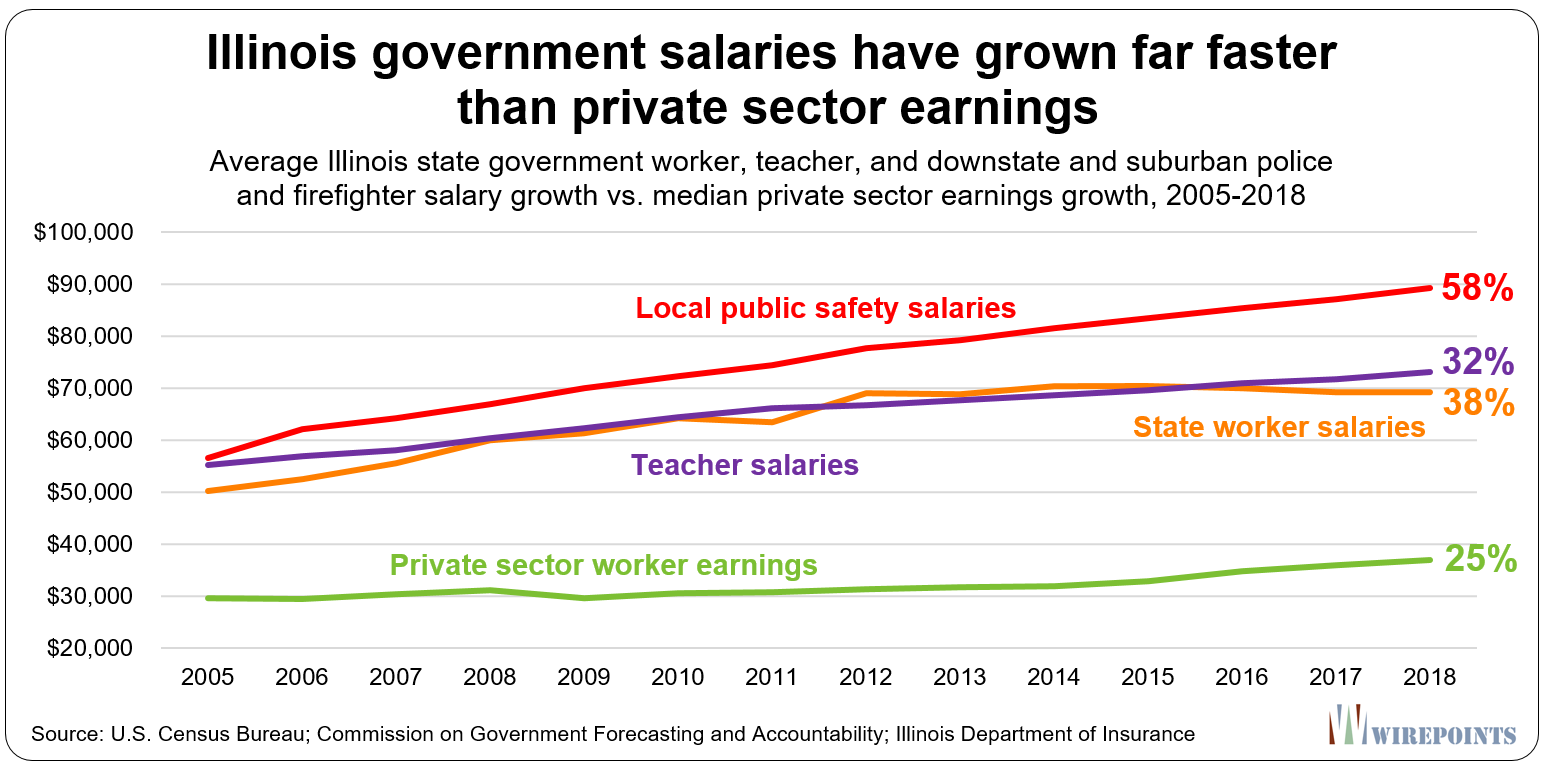
City workers deserve compensation commensurate to the risks inherent in their jobs. However, their compensation must be in line with what local communities can equitably afford.
Conclusion: Failed “solutions” and the need for a pension amendment
Perhaps what best captures how dysfunctional local public safety pension plans have become is the following: Illinois residents have quadrupled their annual contributions to Illinois’ 650 police and firefighter funds since 2003, yet the debts they are on the hook for have more than tripled during that same time.
Even more, despite city funding efforts, retirement security for public safety workers continues to collapse. The collective funded ratio of police and firefighter funds fell to 55 percent in 2019, down from 62 percent in 2003.
 Illinois’ situation has gotten worse because real, structural solutions to the local pension crisis continue to be ignored in favor of delays and quick-fix “solutions.”
Pension debt “reamortizations” – pushing off the repayment of pension debts further into the future – only endanger worker retirement security and allow lawmakers to shove the problem onto future generations.
Pension obligation bonds (POBs) give the illusion of reducing city burdens, but local taxpayers still owe the same amount of debt. What’s worse, POBs let lawmakers gamble with taxpayer dollars in their attempt to reduce pension shortfalls.
Even the recently-implemented consolidation of public safety assets for investment purposes, touted as a “momentous achievement”, does nothing to solve the local crisis. There’s no guarantee asset consolidation will improve the health of the pension funds, but it does give lawmakers an excuse to celebrate “reforms” and, again, delay the implementation of real solutions.
Higher taxes and fees are the other go-to solution for cities across Illinois, but as we’ve shown, increases simply haven’t worked. More taxes have only added to the nation’s worst property tax burden and contributed to the hollowing out of cities.
Illinois’ current group of legislators continues to avoid pension reforms, but this report shows the increasingly negative impact of their refusal to engage. For many cities, the math no longer works.
An amendment to the pension protection clause, followed by subsequent reforms, is the only way to solve Illinois’ local pension crisis. At Wirepoints, we’ve laid out the case for why pension reform is both necessary and urgent. We’ve scored a baseline reform plan for Illinois. And, importantly, we’ve made the case for why pension reform is legal, countering the claims that pension reform in Illinois is a “fantasy.”
Appendix A. Methodology
Source data
Downstate and Suburban Police and Firefighter funds
Downstate and Suburban Police and Firefighter Pension Fund data for individual municipalities was retrieved from the Illinois Department of Insurance’s (DOI) Public Pension Division, Public Pension Reports: Book II Detailed Financial Data. Data for fiscal year 2019 is available on the DOI’s website; fiscal year 2003 data was obtained via a FOIA request to the DOI.32
Illinois has nearly 650 local public safety pension funds, excluding those in Chicago, with over 40,000 active and retired police and firefighters and a combined accrued pension liability of $27 billion. The 175 cities in this report cover 34,000 of those members and $23 billion of those liabilities.
To allow for a like-for-like comparison, only cities that have their own independent police and firefighter pension funds are included in this analysis. Cities that make payments to multi-community fire protection district pension funds are excluded.
Illinois Municipal Retirement Fund (IMRF) funds
Illinois Municipal Retirement Fund (IMRF) fiscal year 2003 and fiscal year 2019 data for individual cities was obtained via a FOIA request to the IMRF.
Unlike Illinois’ individual downstate police and firefighter pensions, the IMRF is operated as a single fund. It covers 300,000 active and retired local non-public safety employees that work for cities, villages, counties and all other local governments in Illinois.
IMRF pension assets are consolidated for investment purposes. However each government maintains an individual account with the IMRF which maintains the entity’s pension assets, liabilities, employer contributions and other related data. Each year, IMRF officials determine a government’s required contribution to the fund based on the data in its individual account.
Wirepoints only included IMRF data directly associated with municipal governments in this analysis. City residents are on the hook for the IMRF pension liabilities of other governments such as school districts, park districts, libraries and more, but those costs are not included in this analysis.
Wirepoints also only included IMRF “Regular” fund pension data in this analysis. Municipal pension data for the Sheriff’s Law Enforcement Personnel (SLEP) and Elected County Officials (ECO) funds, which comprise less than 10 percent of the IMRF’s overall liabilities, is not included.
City budget data
Individual city budget data for fiscal year 2003 and fiscal year 2019 was retrieved from the Illinois Comptroller’s Local Government Division, Financial Databases.
City demographic data
Individual city demographic data, including population, households and household incomes, was retrieved from the U.S. Census Bureau’s American Community Survey. Wirepoints used “5-Year Estimates” tables in order to capture the demographic data of smaller cities.34
Please note that the American Community Survey does not provide data prior to 2005. Year 2000 city demographic data from the Census was used as a proxy for 2003 data when calculating Metric 4 and Metric 5 results.
Metrics methodology/notes
1. Police pension funded ratio
- Reported directly from DOI’s Public Pension Reports: Book II Detailed Financial Data.
2. Firefighter pension funded ratio
- Reported directly from DOI’s Public Pension Reports: Book II Detailed Financial Data.
3. Municipal (IMRF) funded ratio
- Reported directly from the results of a Wirepoints FOIA request to the IMRF.
4. City pension debts per household as a percentage of median household income
- Calculated by dividing a city’s combined police, firefighter and IMRF unfunded pension liabilities by the number of households in the city. That result is then divided by the city’s median household income.
- Year 2000 city household data from the Census was used as a proxy for 2003 city household data.
5. City contributions per household as a percentage of median household income
- Calculated by dividing a city’s combined police, firefighter and IMRF pension contributions by the number of households in the city. That result is then divided by the city’s median household income.
- Year 2000 city household data from the Census was used as a proxy for 2003 city household data.
6. City contributions as a percentage of total budget
- Calculated by dividing a city’s combined police, firefighter and IMRF pension contributions by the city’s total revenues.
- Total revenues includes all city funds (general, special revenue, debt service, fiduciary funds, etc.).
7. Ratio of city contributions to employee contributions
- Calculated by dividing a city’s combined police, firefighter and IMRF pension contributions by combined employee police, firefighter and IMRF contributions.
8. Percentage surplus/shortfall in actuarial contributions recommended by the DOI
- Calculated by subtracting a city’s actual police and firefighter contribution from the Illinois Department of Insurance’s recommended actuarial contribution. That result is then divided by the DOI’s recommended contribution.
- As of January 1, 2011, local police and firefighter pensions are required by state law to reach 90 percent funded by the end of FY 2040. The DOI’s recommended actuarial contribution is calculated as the amount required, as part of a payment ramp, to reach that 90 percent funded ratio.
- The IMRF has a similar actual funding requirement for cities. Wirepoints excluded IMRF contributions from Metric 8 to focus on the deeper funding crises of police and firefighter funds as IMRF pensions are, in general, far better funded than their public safety counterparts.
- DOI recommended contributions are calculated the year before the city’s actual contributions are set to occur. For example, the DOI’s recommended 2019 contributions are included in the 2018 Book II Detailed Financial Data report. As Wirepoints only has Book II Detailed Financial Data reports dating back to 2003, we could not compare actual 2003 city contributions to the DOI’s 2003 recommendations. Instead, Wirepoints compared actual 2004 city contributions to the DOI’s 2004 recommendations as contained in the 2003 Book II Detailed Financial Data report.
Asset-to-payout ratio
- Calculated by taking a city’s combined police and firefighter fund assets and dividing them by the funds’ total annual payout to pension beneficiaries.
- Wirepoints excluded IMRF contributions from Metric 9 to focus on the deeper funding crises of police and firefighter funds as IMRF pensions are, in general, far better funded than their public safety counterparts.
Worker-to-beneficiary ratio
- Calculated by dividing the number of active public safety workers in a city by the number of public safety beneficiaries (including regular retirees, survivors, disabled members, etc.) receiving annual payouts from the police and firefighter pension systems.
- Only police and firefighter membership data is included in the worker-to-beneficiary ratio metric because IMRF active FTE membership data is unreliable, according to IMRF officials Wirepoints spoke to.
Data Exceptions
2003 data
- 2004 city revenues used: Bellwood, East St. Louis, Melrose Park & Mt. Prospect
- 2004 police and firefighter city contributions used: Maywood
- 2005 IMRF pension data used: Morton Grove
- 2004 firefighter pension fund data: Bradley
- City of Sterling total revenues excludes Discretely Presented revenues. IMRF actuarial data from 2005, IMRF employee and employer contributions from 2002.
2019 data
- 2018 city revenues used: East St. Louis, Harrisburg, Harvey, Zion, Westchester, Sauk Village, Robbins, Markham
- 2018 city revenues used: University Park.
- 2018 police, firefighter and IMRF pension data: Rochelle.
- 2018 firefighter pension data: Blue Island, Monmouth.
- City of Sterling total revenues excludes Discretely Presented revenues
Appendix B. Summary of scores for Illinois’ 175 largest cities
 A mess of uncertainty and litigation is sure to follow.
 With $162 billion more from taxpayers, couldn’t you deliver a few bond upgrades, too
Does it really matter, when it comes down to it the feds will just continue to fund all the Illinois stupidity. As bad as it might seem, I just don’t believe anything is actually going to happen. I think this will just continue to chug along as more and more people who work in the private sector leave the state, and Magic Mouse click money comes in from the fed, and continues to allow the Fraudsters to run the state. Good luck to the people who stay.
You want to feel sorry for them.
But then you remember Illinoisans have the freedom to stop the suffering by leaving the state.
You pensioners better start stacking your real assets because the whole thing is going to go down in flames within 3 years or so, as NoHope suggests. Taxes and politicians will mean little at that point. I’m out of my former home state already, I suggest you get out too. Chicago I know right now is hot and the welfare hooligans are going to spill over to more than just Austin or Kenwood much sooner than anyone wants to admit.
With the recent Red State Bailout of Blue States like Illinois, I’m guessing there is a narrowing 3yr window to exit before the ‘Big One’ happens.
The markets and economy in general are not going to make it past 3 years, 2025, you are correct. I foresee a chain reaction coming within the next 3, probably March or September of 2022 (maybe this September but I doubt it, it’ll be exuberance and grandstanding after some shifty reopening bs) or 2023. It won’t be fun. Get ready for war (world) this decade, too. I hope I’m wrong, we are long overdue, though.
Let’s see how Pensions Paid First spins this little doozy. Come up from your mother basement and start typing!!
He’ll suggest you buy bags of asphalt repair at Home Depot to fix the potholes on your street yourself and get a FOID card and gun for protection when the police fail to show up. As we know, municipalities have a constitutional obligation to pay their retired employees above all else.
As long as PPF get’s his money first, the rest can fend for themselves. “First hog to the trough is always the fattest!”
Ya look at Pritzker
After an incredible compilation of data (and I like the grading system as well), Wirepoints uses it to assert that pension reform is a necessity. Commenters like Pensions Paid First of course would disagree, but it strikes me that the burden is on him to describe the alternative. First, the trends are completely going in the wrong direction (even Naperville is trending down, even if only by a small margin). How do you arrest these trends without pension reform? Second, even if the “answer” is for these cities to gamble with pension obligation bonds (and hope upon hope that the… Read more »
PPF, your phone is ringing…………………..hello, hello is anyone there? Hummm………….. all I hear is crickets! My guess is, his mother forgot to pay his phone bill this month.
Great work WP. Post this on a board on 294.
Although not a surprise what a shocker of a report.
And folks want to trust these Government people when they say take a vaccine that is not FDA approved?
Bonkers.
Outstanding research product by Wirepoints, even if it should scare the heck out of anyone living in Illinois. And it raises the obvious question of what are our public officials doing to address this disastrous situation? Why aren’t any of our statewide officials, civic organizations or media focusing on this? This crisis will get the same treatment that the State of Illinois pension crisis receives– a big yawn and no solutions proposed. It is absolutely incredible that the taxpayers of Illinois aren’t demanding some action.
Good question why aren’t the taxpayers demanding action, I bump heads with my local school board at least 2 to 3 times a month, and the lame response I receive back omg make your head spin.
Too many benefit from State money with their friends and families.
Wirepoint, although I have already left Illinois, I am still grateful for articles like this one. It helps me with discussions I still have with loved ones still in the state. When they complain about the high taxes and poor services, I can explain why that is happening and why it will continue or worsen.